
BB Cephei / BB Cep
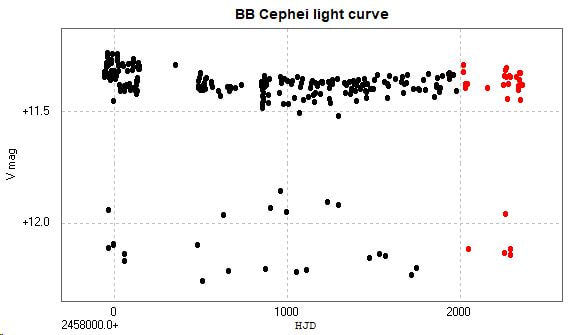
Light curves and phase diagrams of the EA type eclipsing binary BB Cephei / BB Cep, made with the COAST telescope using a V filter.
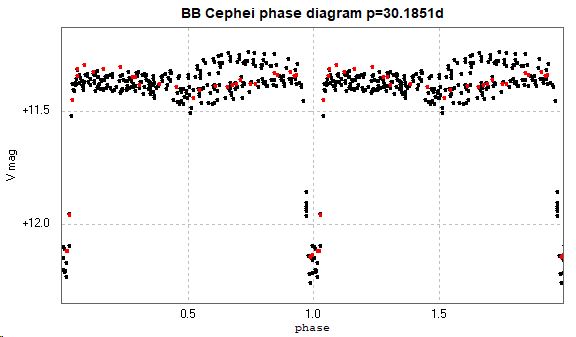
The light curve changes almost from cycle to cycle, and the phase diagrams consequently change over time, which will become evident in the following phase diagrams. Note that these results start with the most recent and older ones follow on.
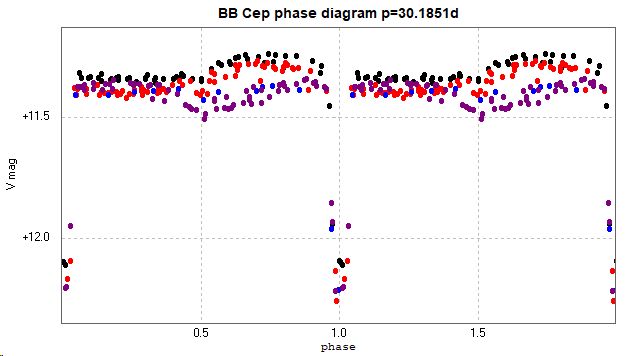
The catalogue period for this system is 30.1851 days (GCVS, AAVSO VSX accessed 2024 February 21), and is used in the following phase diagrams.
Some comments;
In my data, the 'doubling' of the maximum between phase 0.5 and phase 1 is not always present.
This behaviour can be modelled in BM3 by adding a star spot on the primary at the appropriate longitude. This spot may be 'bright' or 'dark' to generate the two different shapes, one at a time. Whether this is a realistic physical solution or not is another matter!
I have checked my results to see if it is an observational artefact, including using several different comparison stars, but nothing is evidently wrong.
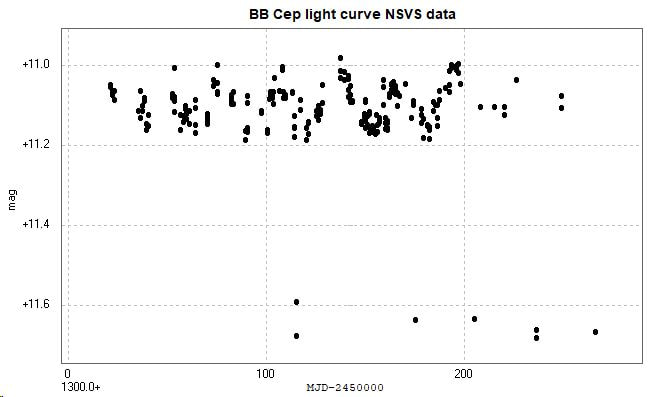
The difference between the two maxima (ie the one before phase 1 and the one after phase 1) is also evident in the NSVS data below.
Additionally, the NSVS data shows the maximum between phase 0 and phase 0.5 as being slightly curved downwards, unlike my results which show it as being essentially flat.
The NSVS data also shows a clear secondary minimum, which none of my data shows.
Searching for articles about this object have returned no results, suggesting that perhaps it is one to investigate further with higher specification photometry and spectroscopy.
The light curve changes almost from cycle to cycle, and the phase diagrams consequently change over time, which will become evident in the following phase diagrams. Note that these results start with the most recent and older ones follow on.
The catalogue period for this system is 30.1851 days (GCVS, AAVSO VSX accessed 2024 February 21), and is used in the following phase diagrams.
Some comments;
In my data, the 'doubling' of the maximum between phase 0.5 and phase 1 is not always present.
This behaviour can be modelled in BM3 by adding a star spot on the primary at the appropriate longitude. This spot may be 'bright' or 'dark' to generate the two different shapes, one at a time. Whether this is a realistic physical solution or not is another matter!
I have checked my results to see if it is an observational artefact, including using several different comparison stars, but nothing is evidently wrong.
The difference between the two maxima (ie the one before phase 1 and the one after phase 1) is also evident in the NSVS data below.
Additionally, the NSVS data shows the maximum between phase 0 and phase 0.5 as being slightly curved downwards, unlike my results which show it as being essentially flat.
The NSVS data also shows a clear secondary minimum, which none of my data shows.
Searching for articles about this object have returned no results, suggesting that perhaps it is one to investigate further with higher specification photometry and spectroscopy.
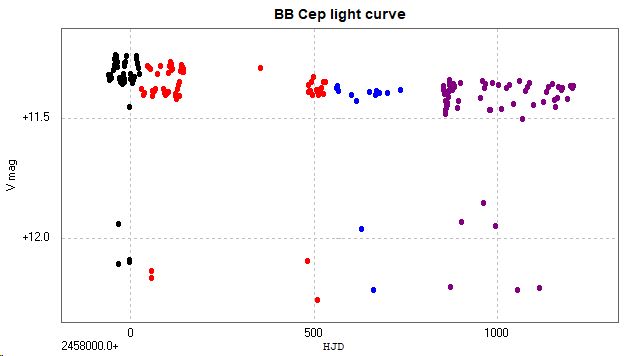
Light curve and phase diagram of 309 observations made from 2017 July 6 to 2024 February 12.
These consist of 278 observations made from 2017 July 6 to 2023 February 1, which are in black, and 31 observations made from 2023 March 18 to 2024 February 12, which are in red. The same comparisons were used throughout, and all images were taken using a V filter.
These consist of 278 observations made from 2017 July 6 to 2023 February 1, which are in black, and 31 observations made from 2023 March 18 to 2024 February 12, which are in red. The same comparisons were used throughout, and all images were taken using a V filter.
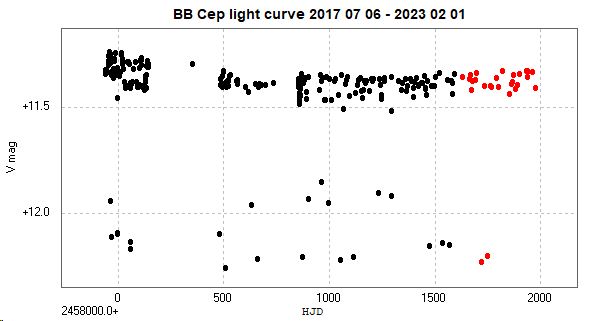
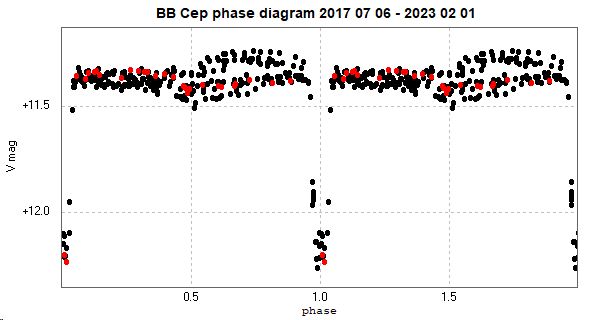
Light curve and phase diagram of 278 observations made from 2017 July 6 to 2023 February 1.
These consist of 250 observations made from 2017 July 6 to 2022 January 12, which are in black, and 28 observations made from 2022 February 17 to 2023 February 1, which are in red.
These consist of 250 observations made from 2017 July 6 to 2022 January 12, which are in black, and 28 observations made from 2022 February 17 to 2023 February 1, which are in red.
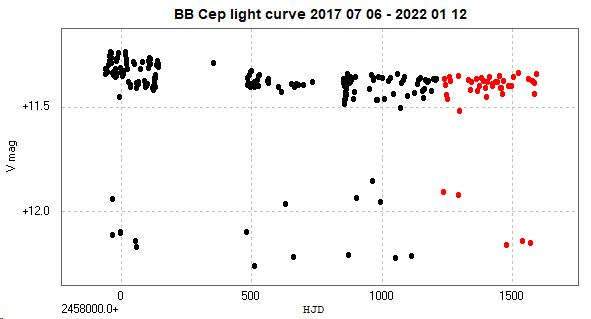
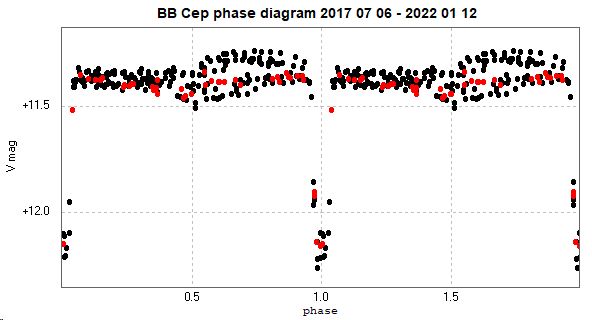
Light curve and phase diagram of 250 observations made from 2017 July 6 to 2022 January 12.
These consist of 207 observations made from 2017 July 6 to 2020 January 12, which are in black, and 43 observations made from 2021 January 18 to 2022 January 12, which are in red.
These consist of 207 observations made from 2017 July 6 to 2020 January 12, which are in black, and 43 observations made from 2021 January 18 to 2022 January 12, which are in red.
Previous observations of his system had been made. 207 images were taken with the Open University COAST telescope between 2017 July 6 and 2020 December 22, again using a V filter. In the following light curve and phase diagram these appear as red data points, while the recent observations appear as black data points.
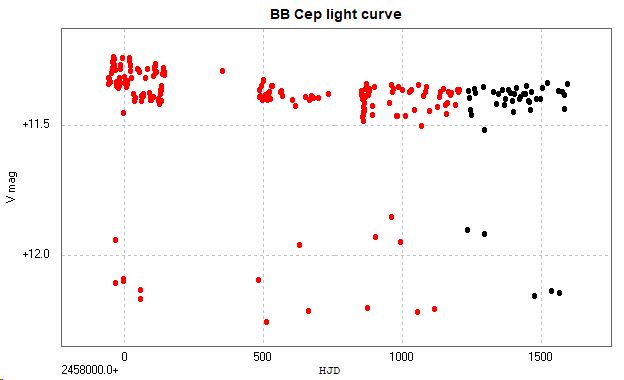
The previous observations are now discussed in more detail. Note that all measurements were made using the same comparison stars.
The data points have been colour coded;
black 56 observations between 2017 July 6 and 2017 September 28
red 72 observations between 2017 October 2 and 2019 February 16
blue 13 observations between 2019 March 19 and 2019 September 7
purple 66 observations between 2020 January 2 and 2020 December 22
The data points have been colour coded;
black 56 observations between 2017 July 6 and 2017 September 28
red 72 observations between 2017 October 2 and 2019 February 16
blue 13 observations between 2019 March 19 and 2019 September 7
purple 66 observations between 2020 January 2 and 2020 December 22
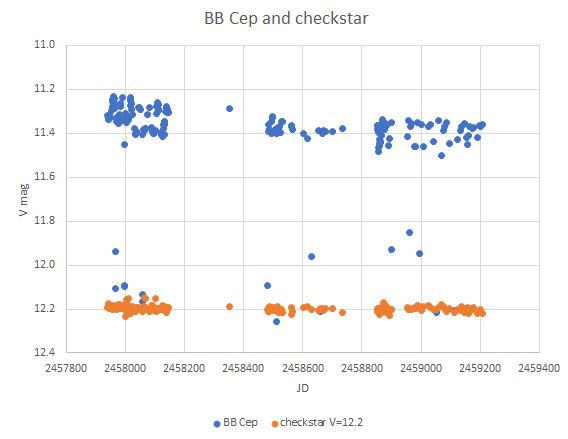
The light curve appears inconsistent over time. To reduce the possibility that this was due to observational errors of some type the following diagram includes the light curve of a comparison star. For further discussion on this see here on this website.
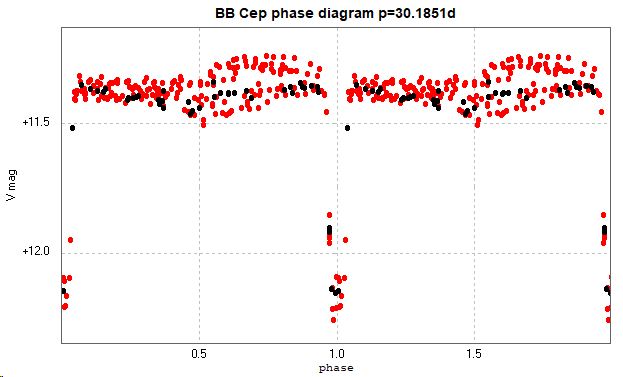
Assuming that the changes are due to BB Cep itself, the above results generated the following light curve, using the same colour code. The period used is that given by the AAVSO VSX for this star.
Initially, the complete phase diagram reduced in magnitude without changing shape (red data points). Subsequently the phase diagram between phase 0 and phase 0.5 stayed essentially constant, but the curve between phase 0.5 and phase 1 went from curving upwards to curving downwards.
This is an example of the O'Connell effect. Lacking further data, including spectroscopic information, experiments with Binary Maker 3 suggest that these changes would be consistent with an area on the leading edge of the larger, cooler component decreasing in luminosity/temperature during these observations, similar to RS CVn stars.
There is a suggestion of a secondary minimum at phase 0.5, which is consistent with the following light curve and phase diagram (p=30.1856d) constructed from data from the Northern Sky Variability Survey (NSVS unfortunately no longer accessible online) for object ID 1457693 during the period May1999 to February 2000. Notably, the maximum from phase 0 to phase 0.5 here dips down slightly, unlike the above results where it is more or less flat.
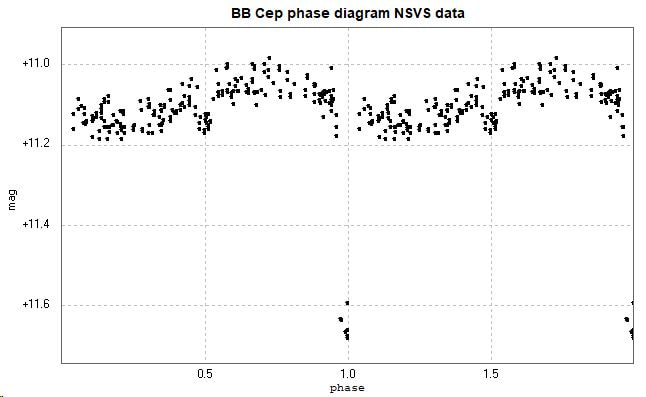
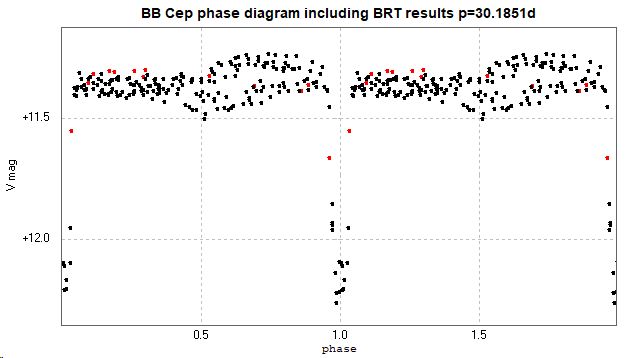
The catalogued period for this star is 30.1851d (GCVS, AAVSO VSX) (accessed 2022 March 21). The 'doubling' of the curve for the maxima is a consequence of the changing magnitude at the maxima over time.
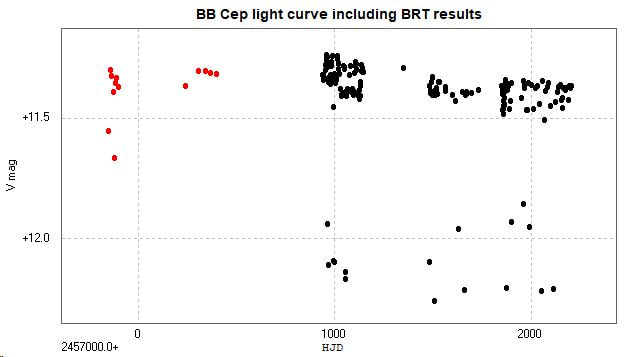
Since doing the above, I discovered that I had previously obtained 13 images with the Bradford Robotic Telescope Galaxy Camera (BRT) between 2014 July 12 and 2016 January 8, using a V filter. These have subsequently been added to the light curve and phase diagram (below) where the Bradford results are in red and the COAST results are in black.
[This page updated 2024 February 21.]
