
BM Cassiopeiae / BM Cas
Please note that this page has been rewritten as of 2023 April 3. The original page can be found below. The reason for this rewrite was some spurious results between 2017 July 6 and 2017 October 22. These were due to the camera then is use having a small field of view which restricted the available comparisons to unsuitably faint objects. These results have been removed from the present article and have also been removed from the databases of the British Astronomical Association's Variable Star Section and the AAVSO.
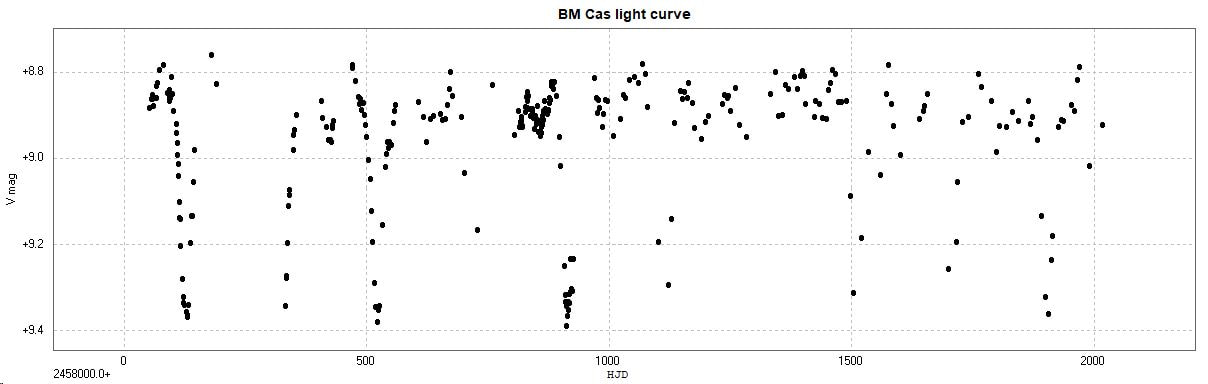
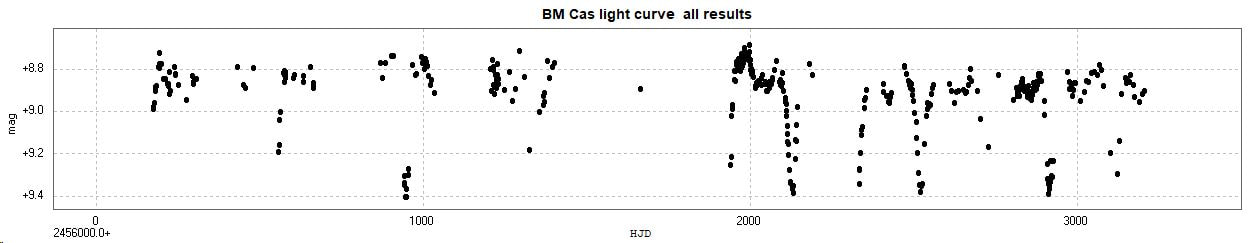
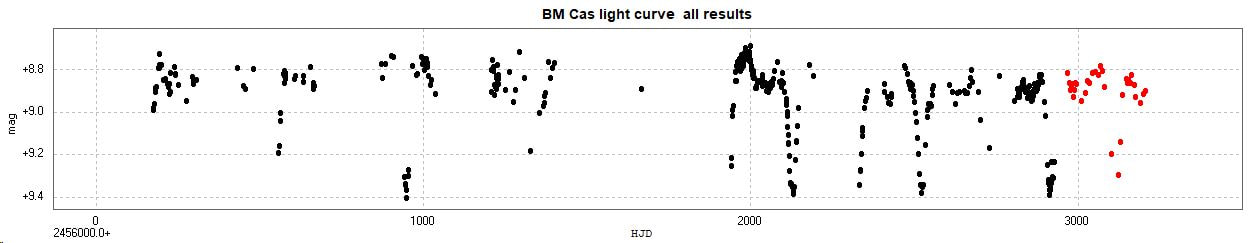
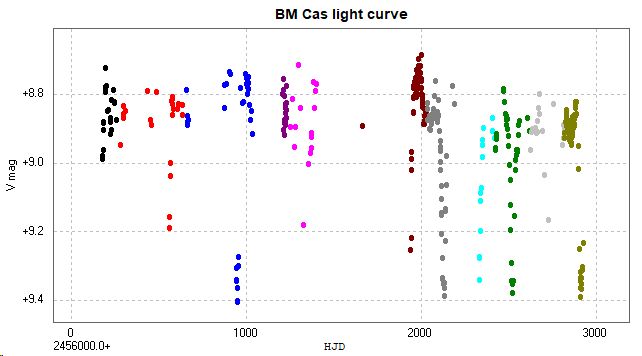
Light curves and phase diagrams of the EB type eclipsing binary BM Cassiopeiae / BM Cas. These consist of 299 observations made between 2017 October 26 (JD2458052) and 2023 March 12 (JD2460016) with the COAST telescope using a V filter.
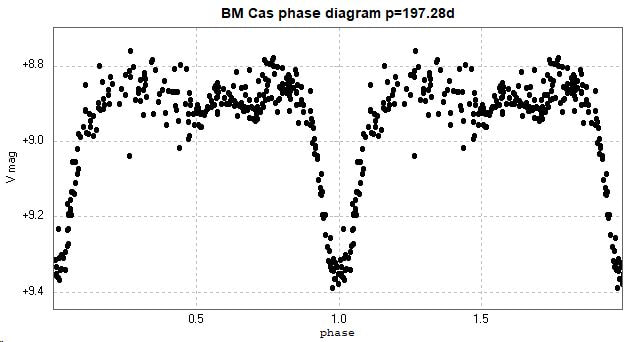
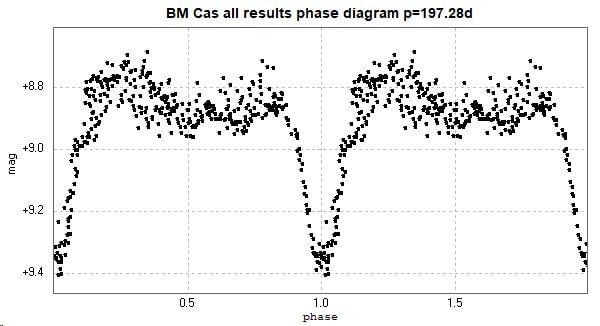
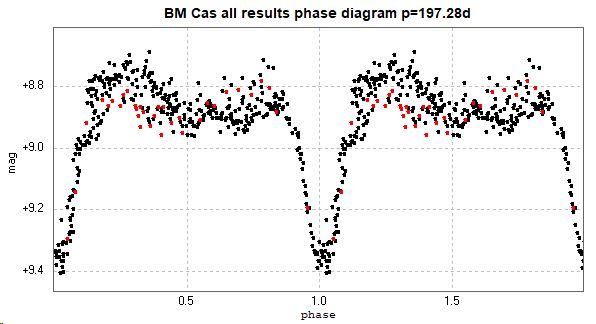
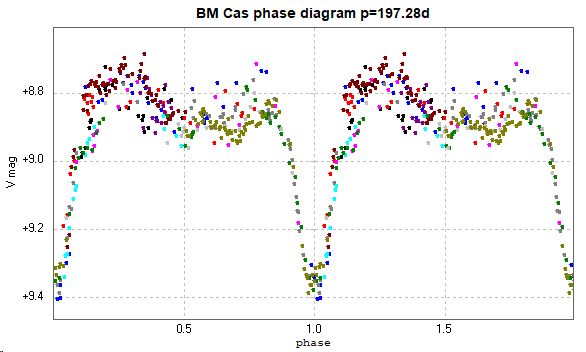
The following phase diagrams have been plotted to the catalogue value of 197.28 days for the period (GCVS, AAVSO VSX, Kreiner) The spectrum is given as A7Iab (GCVS) and A5Ia-F0elab (AAVSO VSX). (Accessed 2023 April 3.)
The following phase diagrams have been plotted to the catalogue value of 197.28 days for the period (GCVS, AAVSO VSX, Kreiner) The spectrum is given as A7Iab (GCVS) and A5Ia-F0elab (AAVSO VSX). (Accessed 2023 April 3.)
The above diagrams are repeated below, with each 197 day cycle colour coded.
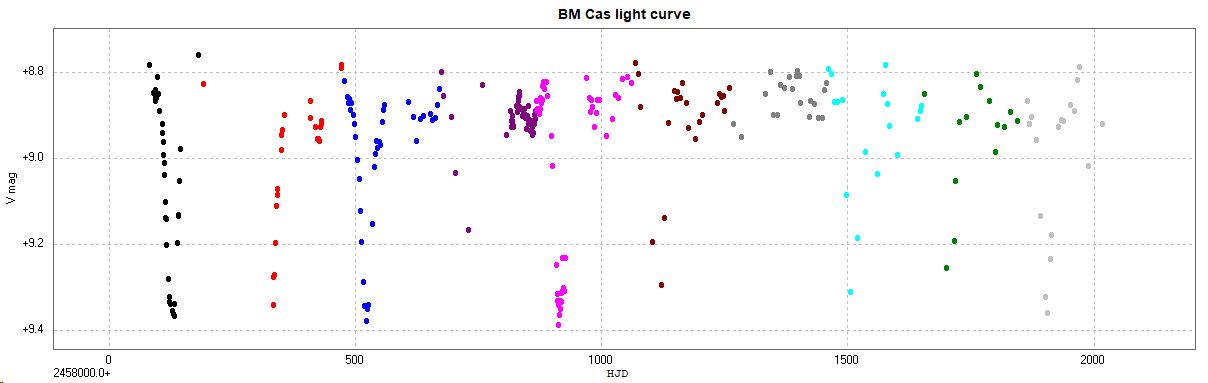
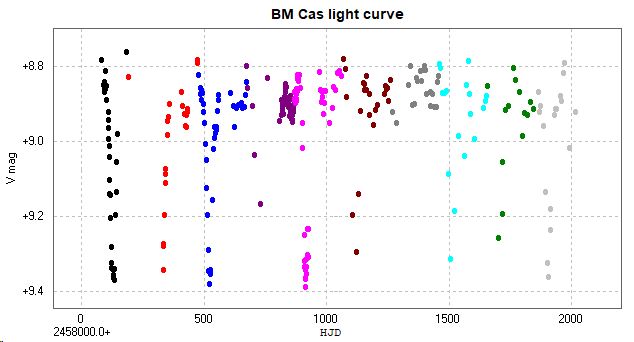
The same light curve but with different scales;
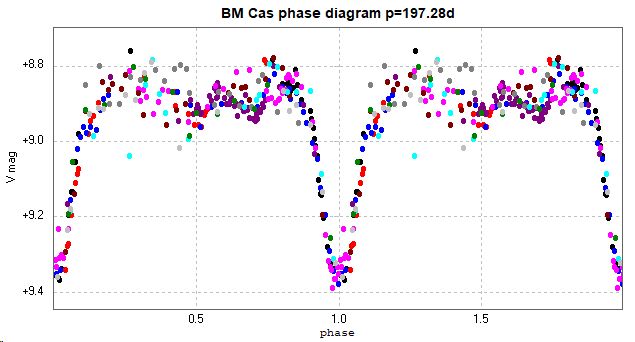
Although there is much scatter in the results, some of this at least is due to actual variation in the light curve. There is slightly greater scatter between phases 0 and 0.5 compared to between phases 0.5 and 1. This might possibly due to changes in a bright spot or hot region on one of the components, as well as to a circumstellar envelope (affecting the erstwhile secondary minimum?) (Pustylnik et al 2007), or might be due to some as yet undetermined type of variations in the hotter component (Fernie 1997), or a 'hot region' located between the two components (Kalv et al 2005, Pustylnik et al 2007). It had been suggested that this behaviour, together with the scatter seen in the light curve at maximum luminosity, might be due to one of the components being an intrinsic variable, eg a Cepheid, (Thiessen 1956), but this has been subsequently discounted.
The decreasing cadence of the observations being returned from the observatory is making it more and more difficult to see what is occurring during any one cycle with any certainty. Consequently this system has been removed from my observing program.
[This page updated 2023 April 3]
The decreasing cadence of the observations being returned from the observatory is making it more and more difficult to see what is occurring during any one cycle with any certainty. Consequently this system has been removed from my observing program.
[This page updated 2023 April 3]
============================================
Archive
2023 April 3 update
The following is the original page, original up to 2023 April 3. It has been kept as an 'archive' because it is referred to in a number of articles in the British Astronomical Association's Variable Star Section circular. They are in editions 184 and 189. It has been replaced by the new information above. The main difference is that the observations for the period 2017 July 6 (JD2457940) to 2017 October 22 (JD2458048) have been excluded from the new analysis. This is because the camera on the COAST telescope was then replaced by one with a larger field of view which contained better comparison stars, which were subsequently used for the rest of the observations. These now disused observations have also been removed from the databases of the BAAVSS and the AAVSO.
This system exhibits a complex light curve. This page has been constructed from observations from a number of different observing sessions which have been analysed as they became available. For the latest results please go to the bottom of this page - just before the 'flickering' section.
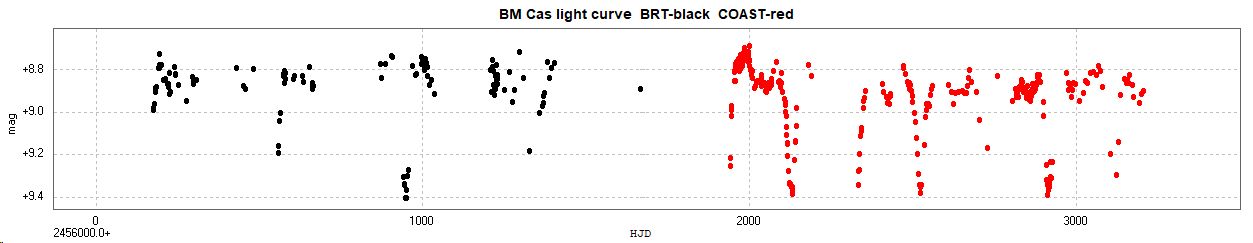
The following light curve and phase diagram were constructed from photometry of 116 unfiltered images taken with the Bradford Robotic Telescope Cluster Camera (BRT) between 2012 September 4 and 2016 October 3, and 288 images taken with the Open University COAST telescope between 2017 July 6 and 2020 December 21 using a V filter. (See below for more recent observations.)
The same light curve but with the BRT and COAST results indicated.
The amplitude of the variation is not constant, but this is not due to the different systems used, rather it appears to be a property of BM Cas itself. For an analysis of this see the section 'Flickering' below.
As of 2021 January 10, the latest series of observations appear to show a particular change to the light curve. The 33 observations made with COAST between 2020 April 29 and 2020 December 21 are shown in red in the following light curve and phase diagram.
The phase diagram of these recent observations on their own appears below.
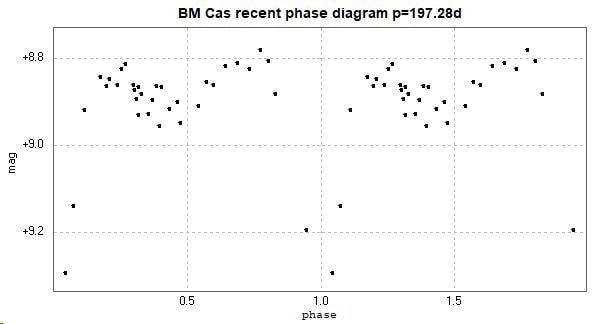
From these observations it would appear that the light curve has recently become more like that of a 'normal' EB type eclipsing binary, without the variations in the maxima. This is, of course, itself a change in the light curve! This might possibly due to changes in a bright spot or hot region on one of the components, as well as to a circumstellar envelope (affecting the erstwhile secondary minimum?) (Pustylnik et al 2007).
2021 August 5 UPDATE
The following light curve and phase diagram were constructed from 129 images taken with the COAST MKII telescope between 2019 November 28 and 2021 July 9. These cover 3 cycles of the system, and are colour coded accordingly.
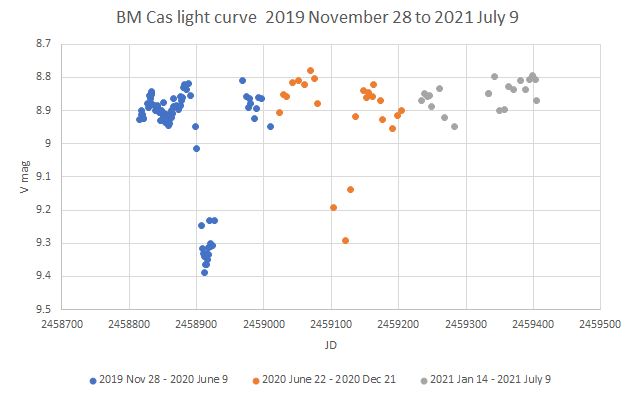
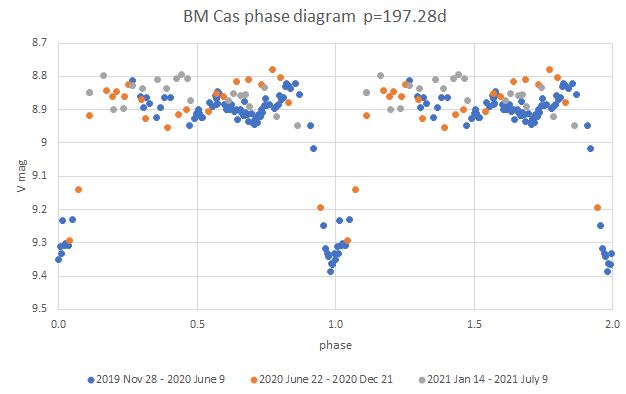
There are more evident changes to the light curve between the primary minima. The magnitude of the section between phase 0 and phase 0.5 has increased slightly during the last cycle, while the section between phase 0.5 and phase 1 increased during the second cycle before fading again during the third cycle. The cause of the variations might be due to some as yet undetermined type of variations in the hotter component (Fernie 1997), or a 'hot region' located between the two components (Kalv et al 2005, Pustylnik et al 2007).
[This section added 2021 August 5]
2022 April 4 UPDATE
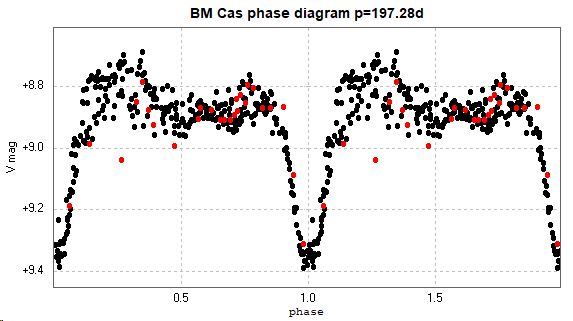
The following light curves and phase diagram were added on 2022 April 4. The results are colour coded; black for 309 observations made between 2017 July 6 and 2021 July 9, and red for 26 observations made between 2021 July 26 and 2022 March 17. All observations were made with the COAST telescope (upgraded in July 2021) using a V filter.
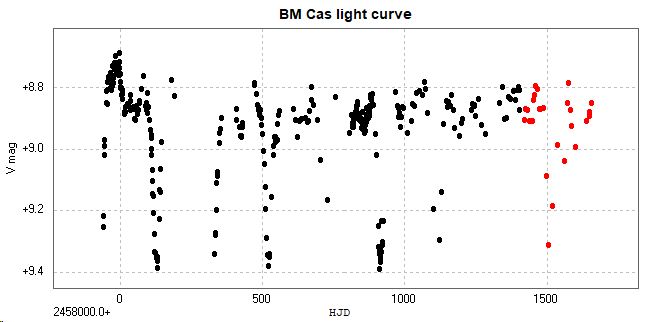
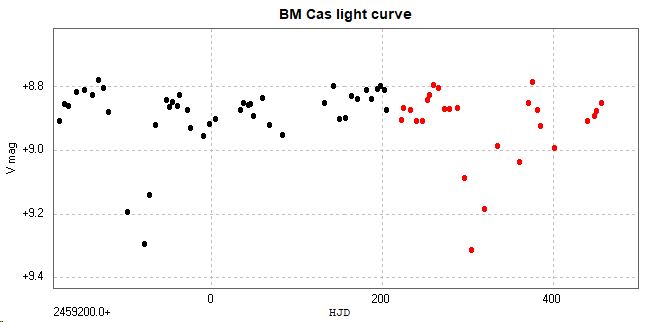
An enlargement of the more recent section of the light curve is below.
Flickering
One notable feature of the phase diagrams is the irregular shape of the rise from primary minimum (at phase 0 / phase 1), which differs from the smoother fall to primary minimum. In particular, the crescent shaped segment brighter than mag 9 might suggest that the star starts 'flickering' by about 0.1 mag. However, closer investigation - see below - appears to show that this particular behaviour is an artefact of plotting the phase diagram using 'gappy' data.
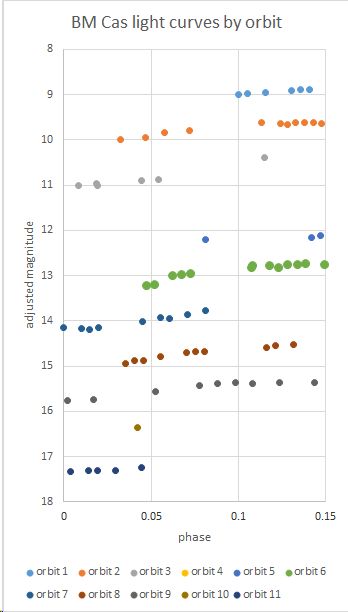
The first part of the complete light curve above, and associated phase diagram, are repeated below, this time with each orbit shown in a different colour, eleven in total.
The section of the phase diagram between phase 0 and phase 0.15 is enlarged below.
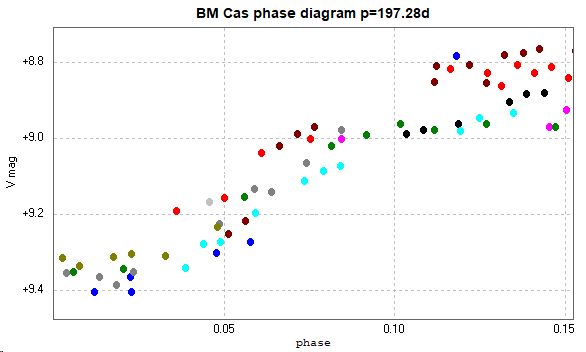
The crescent shaped section brighter than mag 9 appears as a 'hollow' near the top right of this curve, and it can be seen that the brightness for any one orbit does not 'flicker' in the manner suggested by the original phase diagram, but continues to increase in a smoother - monotonic - manner. This is more easily seen in the phase diagram below, where the data for each orbit has been shifted by multiples of 0.2 mag so that the light curves for each orbit can be seen more clearly (note that the colours do not correspond to the colours in the above diagrams).
It had been suggested that this behaviour, together with the scatter seen in the light curve at maximum luminosity, might be due to one of the components being an intrinsic variable, eg a Cepheid, (Thiessen 1956), but this has subsequently been discounted. Instead, the cause of the variations might be due to some as yet undetermined type of variations in the hotter component (Fernie 1997), or a 'hot region' located between the two components (Kalv et al 2005, Pustylnik et al 2007).
[This 'Flickering' section updated 2020 April 8]
