
AC Bootis / AC Boo [ AC Boötis / AC Boö ]
Please see the comments section at the end regarding 'primary' and 'secondary' minima.
Light curve and phase diagram of the EW type eclipsing binary AC Bootis, constructed from 202 unfiltered images taken with the Bradford Robotic Telescope Cluster Camera (BRT) between 2010 July 12 and 2015 September 6. The results have not been transformed.


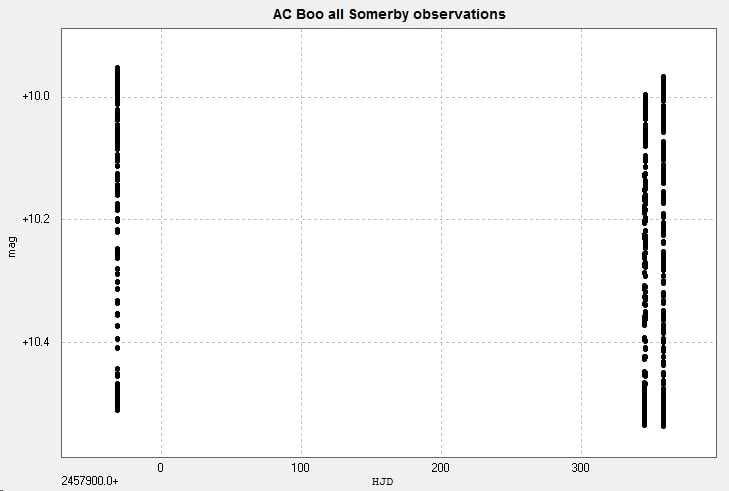
A primary minimum of AC Boo observed from Somerby Observatory with the 2" Titan on 2017 April 24.


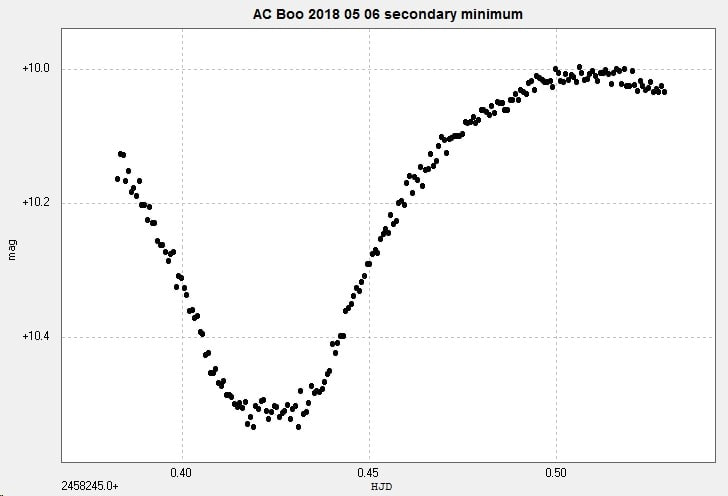
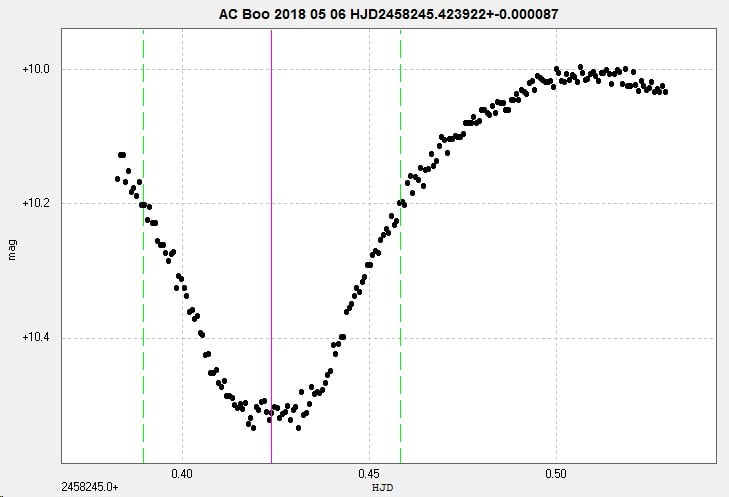
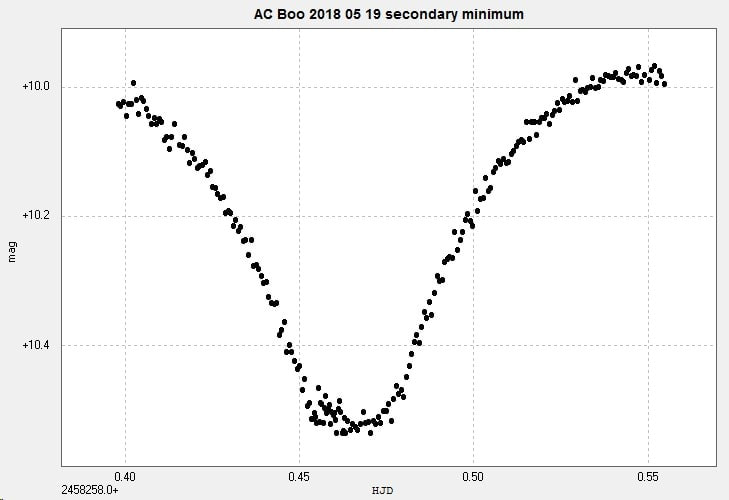
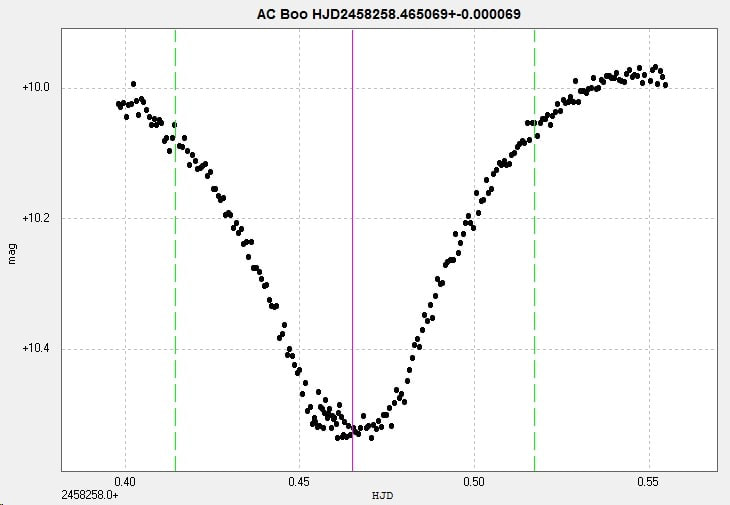
Two secondary minima were observed from Somerby Observatory with the 2" Titan in May 2018.
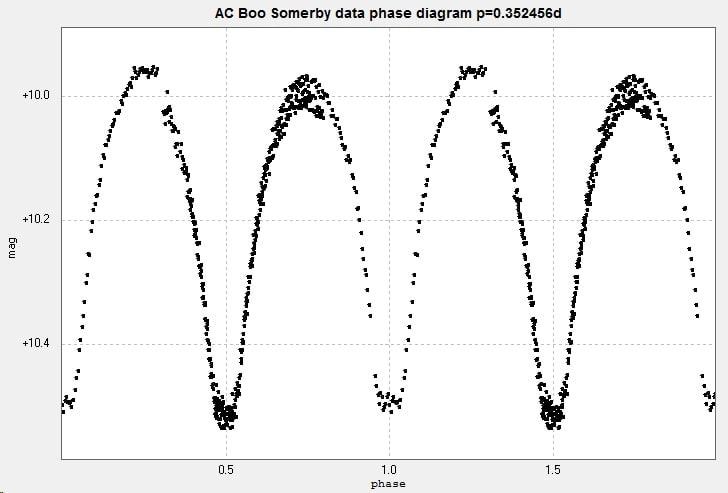
Using just the Somerby data for the one primary minimum and the two secondary minima (above) the following light curve and phase diagram were generated.
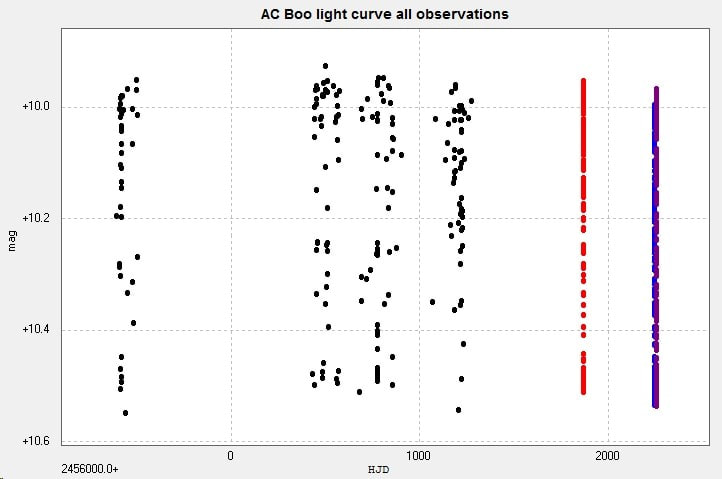
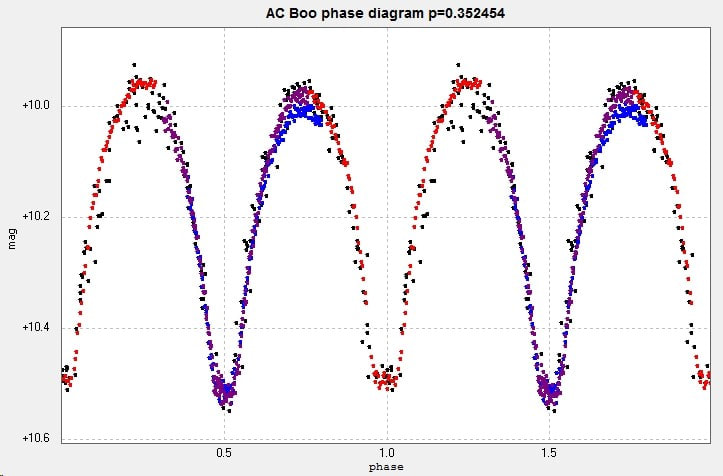
Combining the BRT and the Somerby data generated the following light curve and phase diagram. The BRT data is in black, the primary minimum (Somerby) is in red, the two secondary minima (Somerby) are in blue and purple.
Comments
The catalogued values for the period are 0.3524485 d, ref GCVS, 0.3524484 d, ref AAVSO VSX, and 0.3524540 d, ref Kreiner. (Accessed 2018 May 27)
This star has o-c interest, see Kreiner et al.
The GCVS states that both types of minima (min I = primary and min II = secondary) are of equal depth, 0.53 mag in V band. The primary and secondary minima in the above were identified from data from Kreiner. However, in all the above diagrams, which were constructed from just my own observations from 2010 to 2018, the 'secondary' minima appear deeper than the 'primary' minima. There has been evidence in past observations for changes to the depths of the minima as well as changes to the value of the maximum magnitude. These may possibly be due to the O'Connell effect (temporary bright or dark areas on the surface of one or other component stars). See eg Alton 2010.
More research and more observations needed!
[ This page updated 2018 May 27 ]
