
VW Cephei / VW Cep
Light curves and phase diagram of the EW type eclipsing binary VW Cephei / VW Cep.
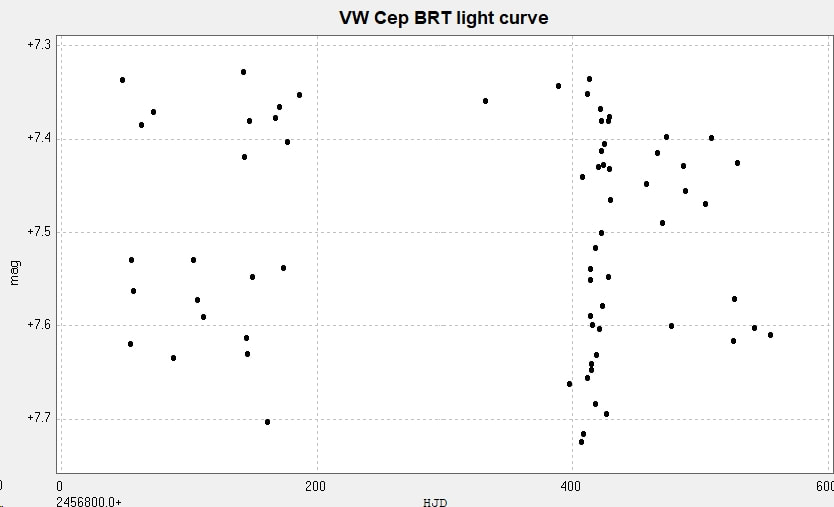
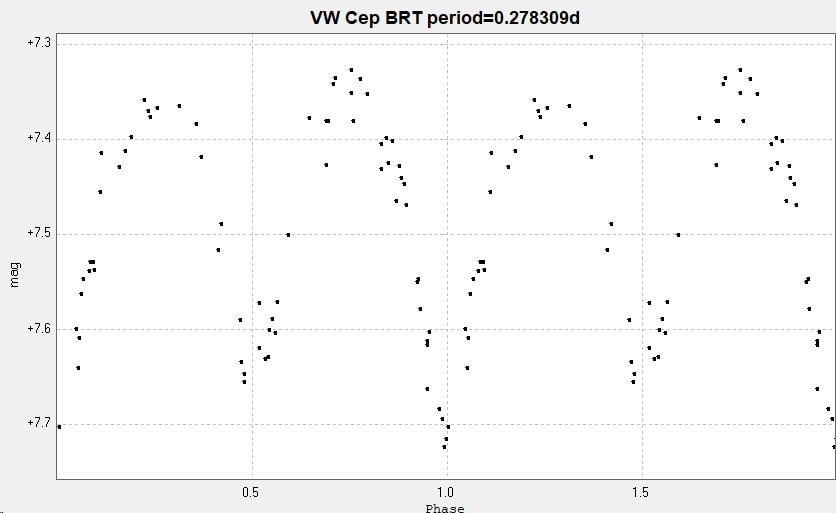
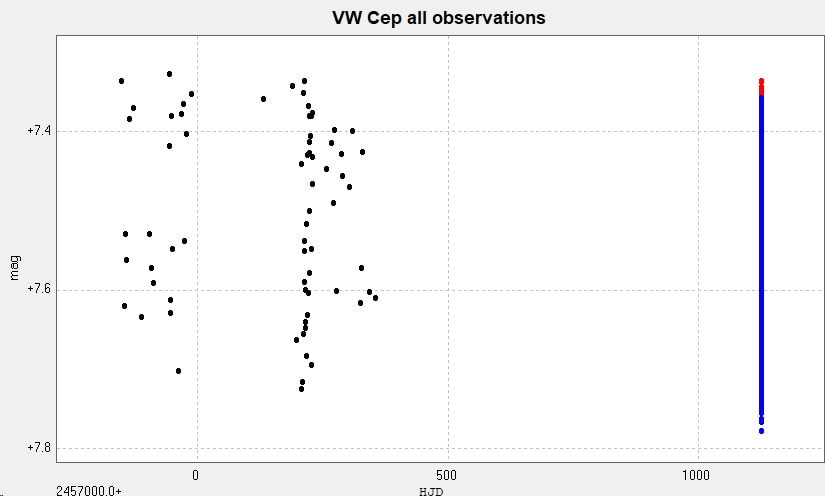
The following light curve and phase diagram were constructed from photometry of 69 images taken with the Bradford Robotic Telescope Cluster Camera (BRT) between 8 July 2014 and 27 November 2015. The images were taken using the green ('tri-colour green' ) filter.
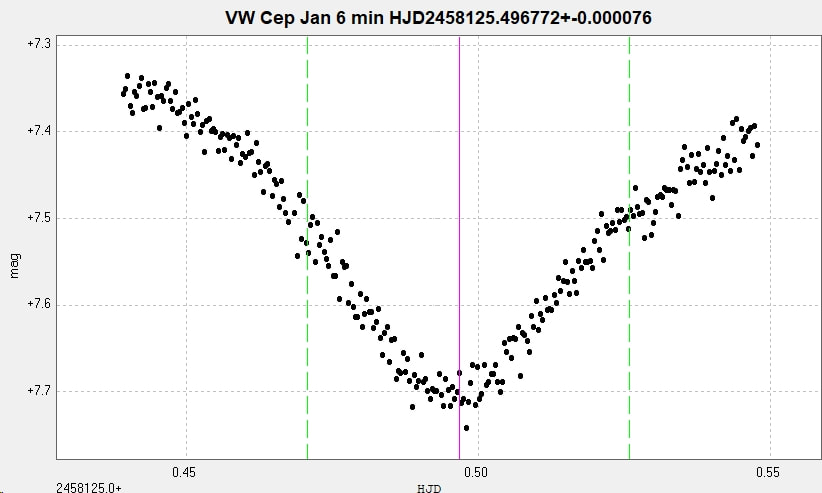
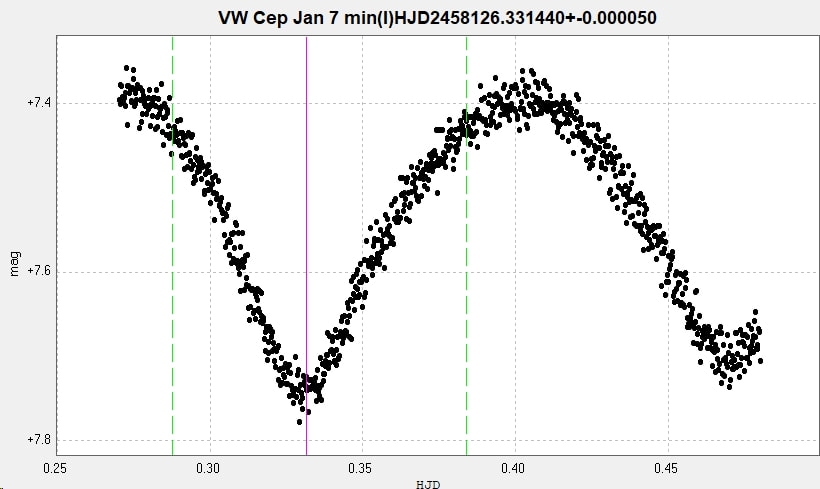
Two primary minima, and some of one secondary minimum, were observed with the 2" Titan at Somerby Observatory on the 6 and 7 of January 2018. (280 images on January 6 and 944 images on January 7.)
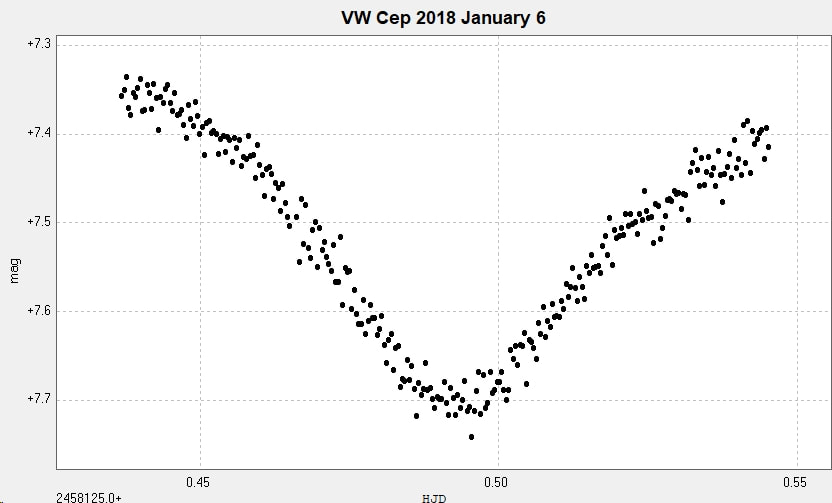
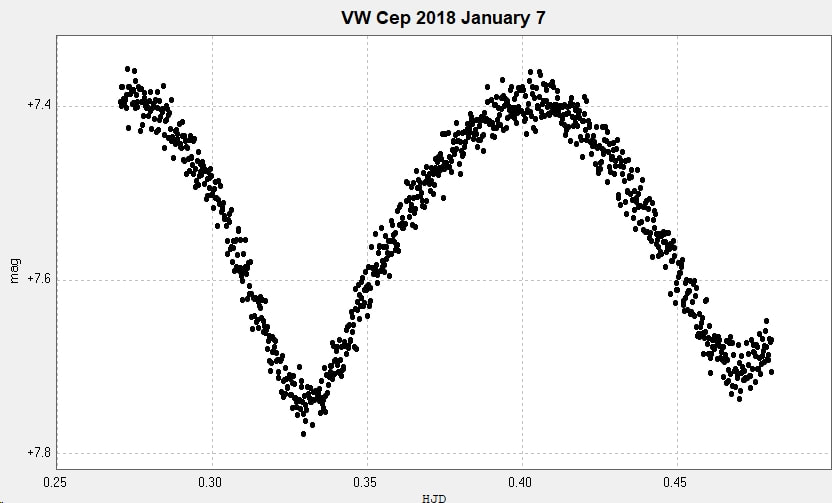
The January 6 minimum was observed with the 2" (50mm) aperture stopped down to 1" (25mm) so that the exposures could be extended (to 33.1s) to try to obviate the effects of scintillation on shorter exposures, and hence reduce scatter. The January 7 minimum images were taken with 19s exposures through the full aperture. All exposures were unfiltered.
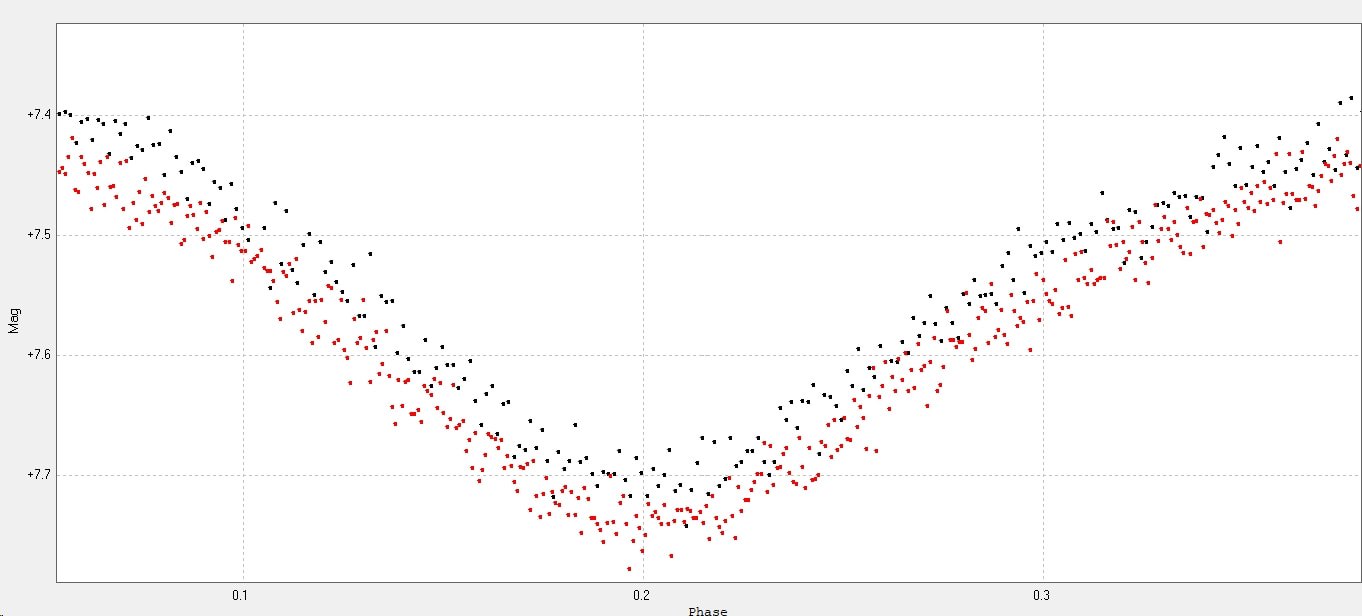
Combining the two sets of results shows a slight reduction in the scatter with the longer exposure, in black in the following diagram. The cause of the small offset in magnitude is not known, both sets of data were reduced using the same comparison stars.
The calculated HJD of the primary minima are shown below.
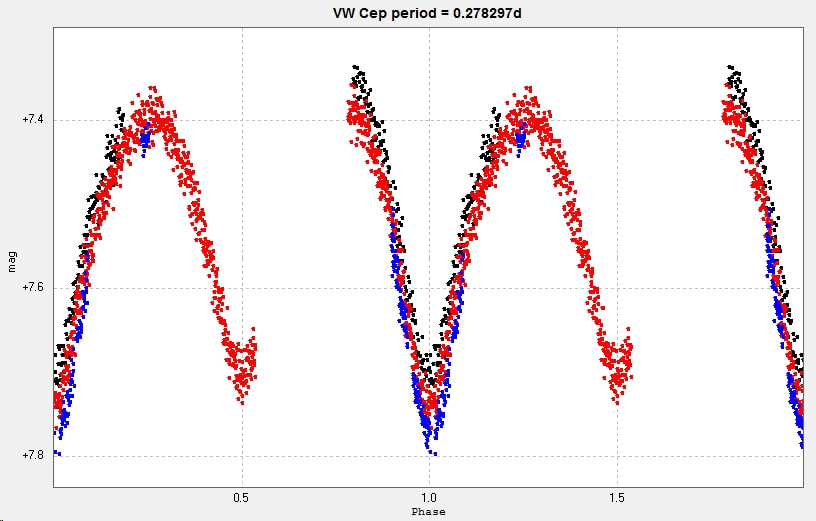
Combining the BRT and the Somerby data generates the following light curve and phase diagram. BRT in black, 6 January 2018 in red and & January 2018 in blue.
The 'best fit' period of 0.278308d compares with 0.27831460 d GCVS, 0.2783089 d (AAVSO VSX) and 0.2783084d (Kreiner).
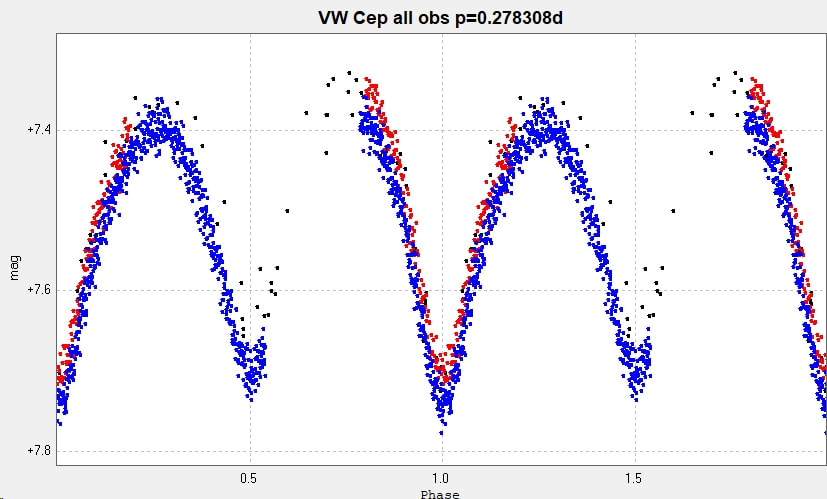
The 'best fit' period of 0.278308d compares with 0.27831460 d (GCVS), 0.2783089 d (AAVSO VSX) and 0.2783084 d (Kreiner). (Accessed 12 January 2018)
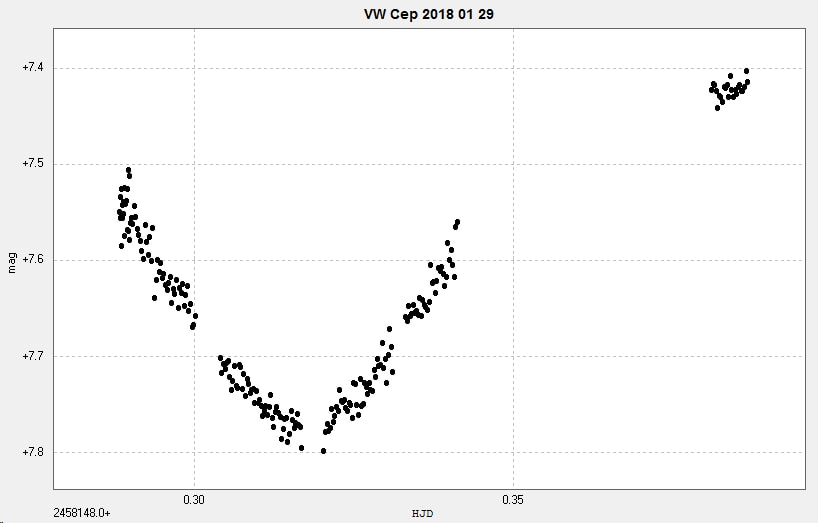
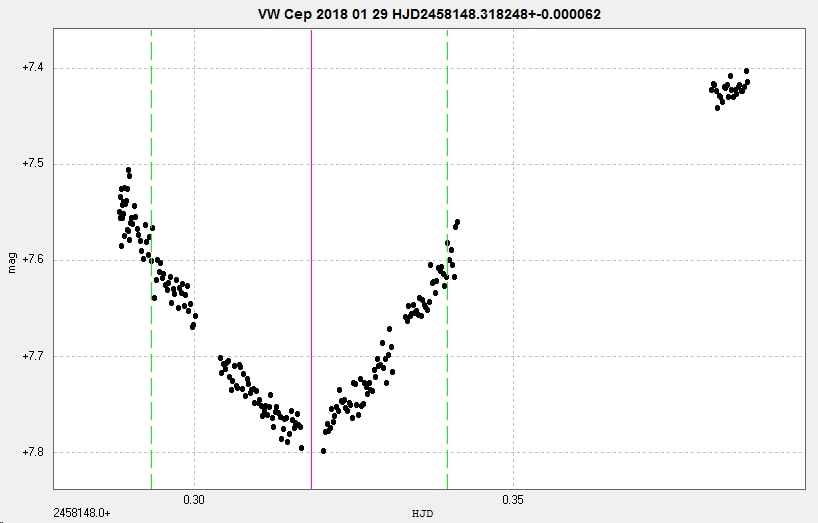
On 29 January 2018 I obtained a further series of 219 unfiltered images with the 2" Titan at Somerby Observatory of a primary minimum (interrupted by cloud) which is shown below, together with a time of minimum estimate.
Adding the three series of observations made from Somerby together generates the following light curve and phase diagram.
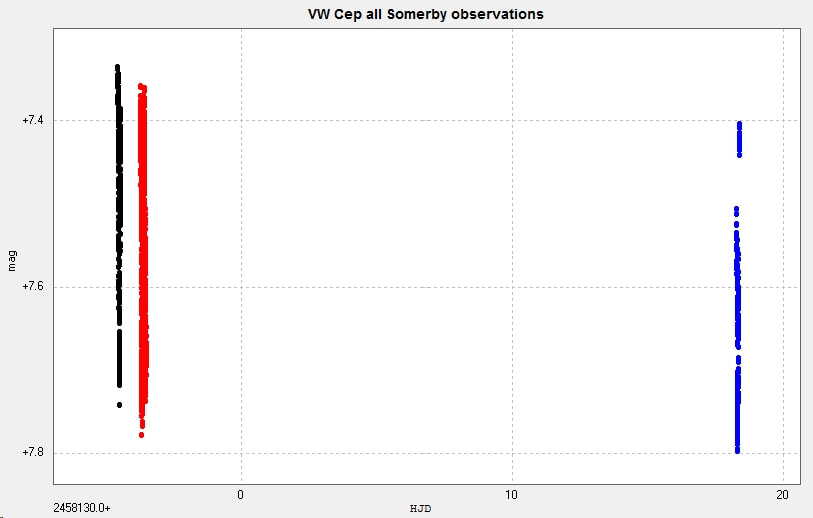
The Jan 6 observations are in black, the Jan 7 observations are in red and the Jan 29 observations are in blue.
The same comparison stars were used in each series of observations. The minima and maxima do not appear consistent. Whether this is an observational artifact or, less probably, something pertaining to the star itself is not clear from these few observations. More observations needed, but see below.
NOTES
There is o-c activity in this system (see Kreiner).
The maxima are not always the same magnitudes as each other, but can alternate. This is an effect known as the O'Connell Effect. See, for example, Wilsey and Beaky 2009.
The maxima are not always the same magnitudes as each other, but can alternate. This is an effect known as the O'Connell Effect. See, for example, Wilsey and Beaky 2009.
[Page updated 29 January 2018]
