
HD 332629
My 15th discovery, confirmed on 2016 February 12, is an eclipsing binary in Cygnus - my first eclipsing binary discovery. AAVSO VSX entry here.
Discovery photometry was from 56 images of my target star, V1765 Cyg, taken with the Bradford Robotic Telescope Cluster Camera between 2014 July 23 and 2015 December 18. Cluster Camera's 'G' (green) filter was used. A period of 2.197348 days is suggested.
This one was difficult. My original submission to the AAVSO VSX consisted of my observations alone, based on the following 'discovery' charts.
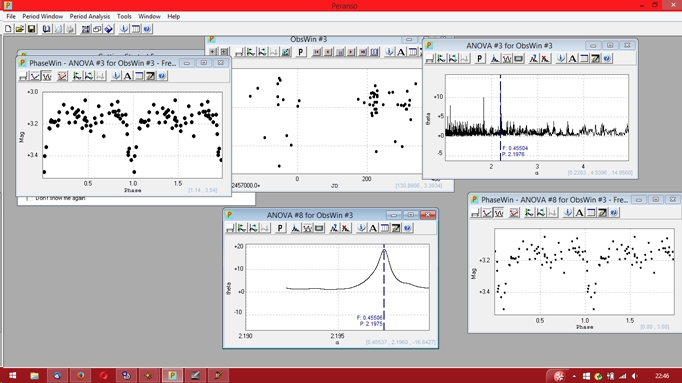
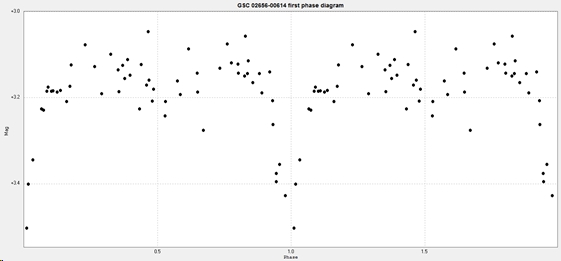
This had a best fit period = 2.1976d, which resulted in the following phase diagram,
It was suggested that I should include results from the Northern Sky Variability Survey (Northern Sky Variability Survey (NSVS) (Wozniak+, 2004)) from 1999 to 2000 to improve the 'accuracy' of the period. The resulting light curve and phase diagram are below,
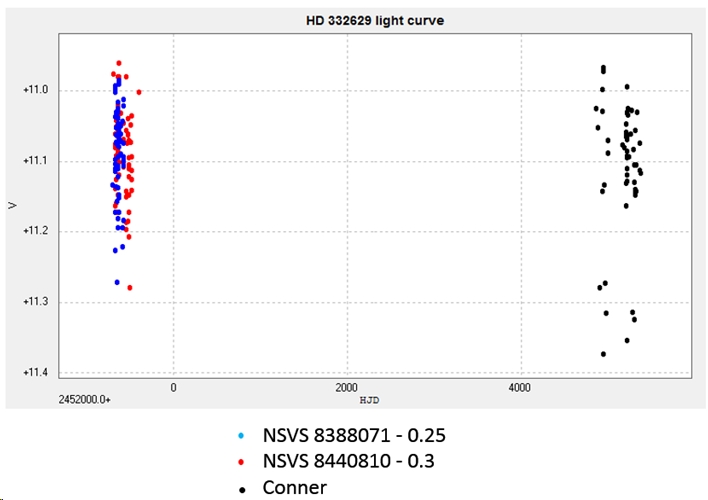
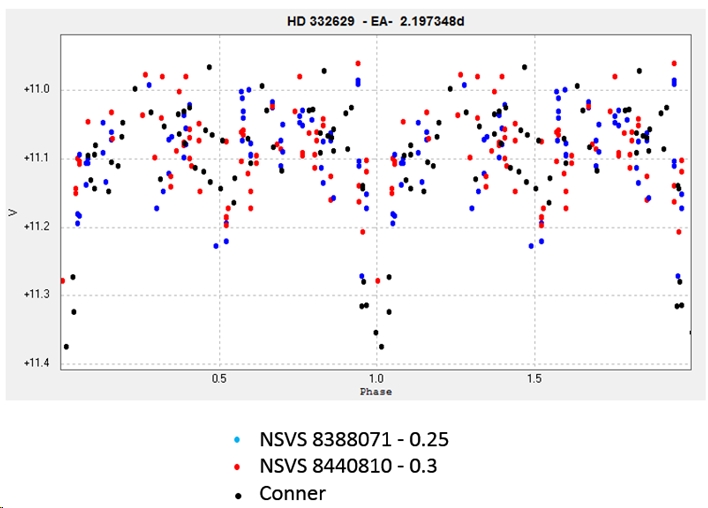
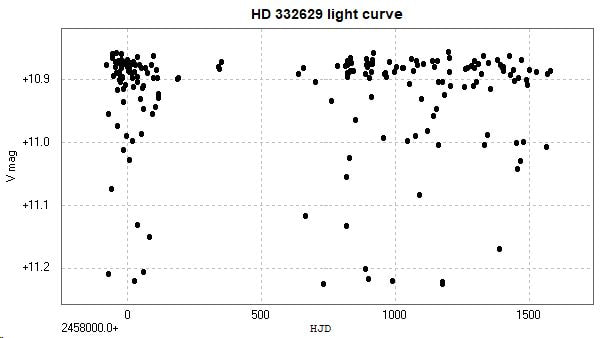
This is plotted with a period of 2.197348 days. The precision of this period is better than one tenth of a second! The curve and phase diagram are very noisy because my photometry is from images exposed for a much brighter star (the mag 6.5 V1765 Cyg), not this mag 11 star. The NSVS data is also very noisy. Ideally, this star will now be observed with correctly exposed images to better determine the shape of the phase diagram. Below are the results to date of observations specifically of this star.
A light curve and two phase diagrams follow, from images taken specifically of this system. They were obtained from photometry of 191 images taken with the Open University COAST telescope through a V filter between 2017 June 17 and 2021 December 29. 174 of these images were taken between 2017 June 17 and 2021 July 8, when COAST consisted of a C14 (14 inch/35cm) Schmidt-Cassegrain, and 17 of these images were taken between 2021 July 29 and 2021 December 29, when COAST had been 'upgraded' to a CDK17 (17 inch/42cm) corrected Dall-Kirkham.
Two phase diagrams follow. The first is plotted with the 'catalogue' period of 2.197348 days, while the second one is plotted to the slightly longer 'best fit' period of 2.197406 days as suggested by Peranso. It is not clear - from my COAST results alone - which might be closer to the true period.
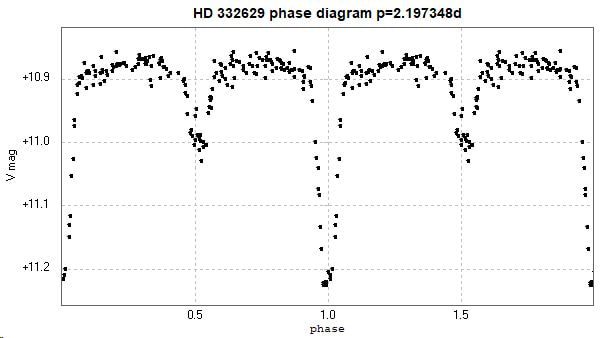
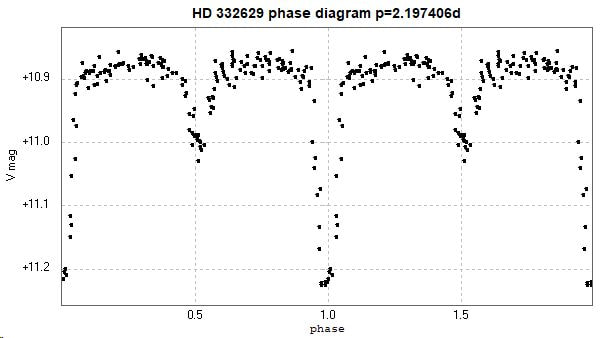
There is some suggestion that the secondary minimum doesn't quite occur at phase 0.5 but is slightly later at about
phase 0.52.
phase 0.52.
[ Page updated 2022 January 16]
