
RZ Ophiuchi / RZ Oph
Light curves and phase diagram of the EA type eclipsing binary RZ Ophiuchi / RZ Oph.
NB Because this system's light curve is not necessarily the same for each cycle, there are updates towards the end of this page with more recent observations added than are included in the main section.
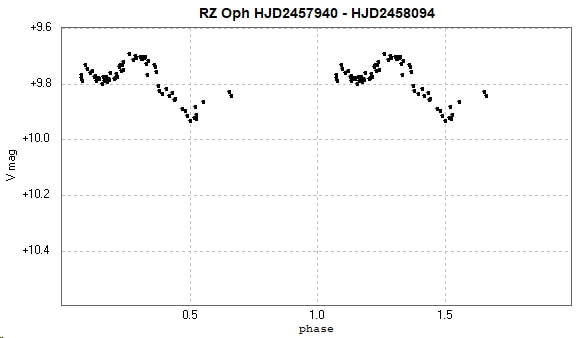
Data has been obtained from photometry of 242 images I requested of this star. 65 images were taken by the Bradford Robotic Telescope between 2014 June 28 and 2015 November 19, using their tri-colour green filter. 177 images have been obtained to date with the Open University COAST telescope between 2017 July 5 and 2020 November 30, using a V filter. The observations have not been transformed.
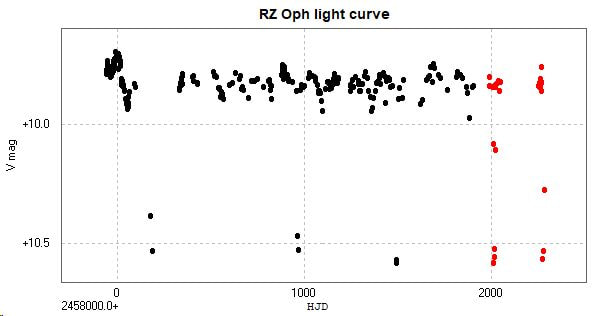
The complete light curve to date is below.
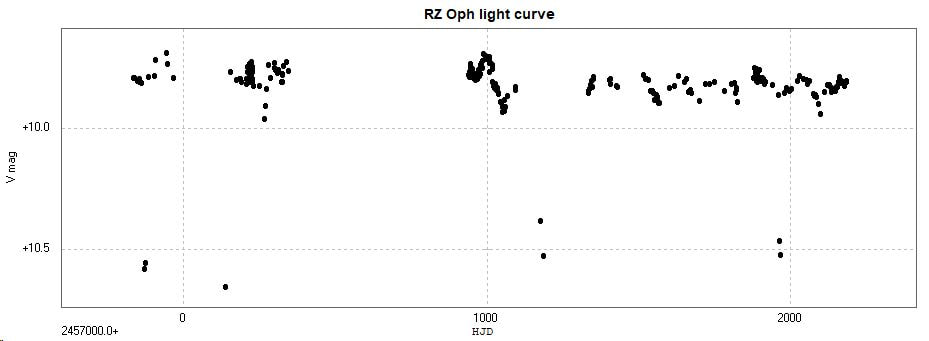
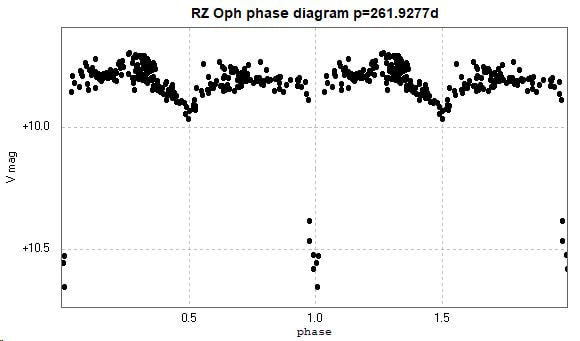
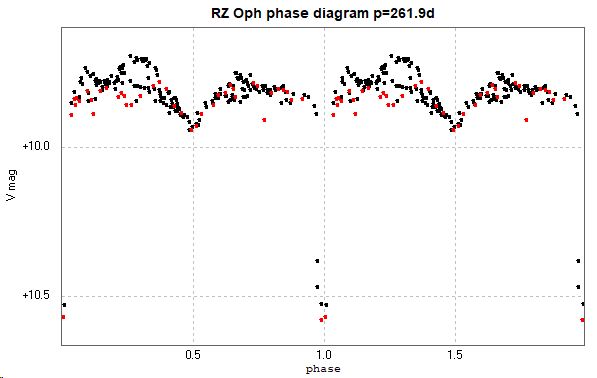
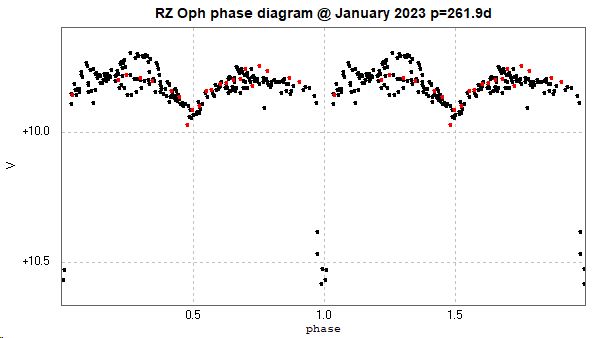
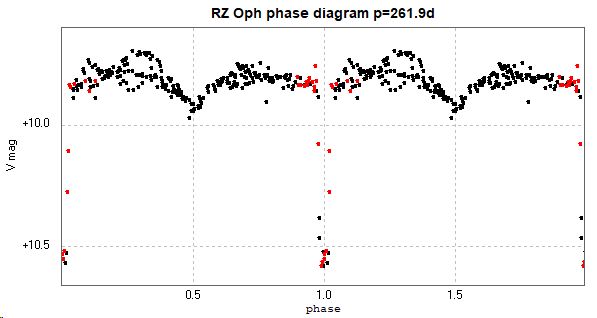
The catalogued period of this star was 261.9277d (GCVS, AAVSO VSX), and 261.926487d (Kreiner) (accessed 2021 January 4). The following phase diagram was plotted with the period 261.9277d.
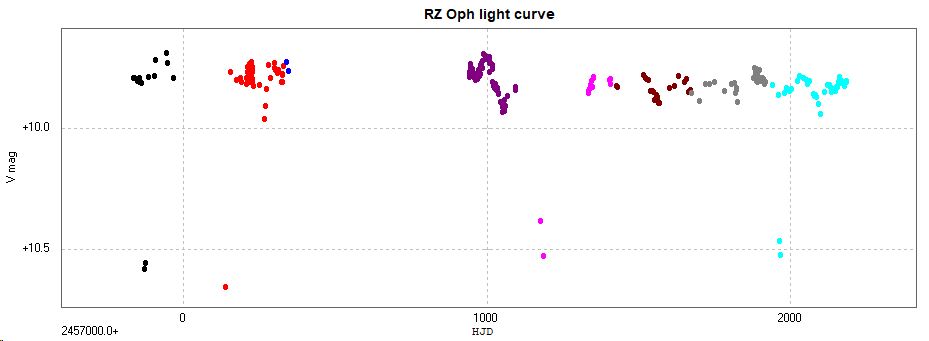
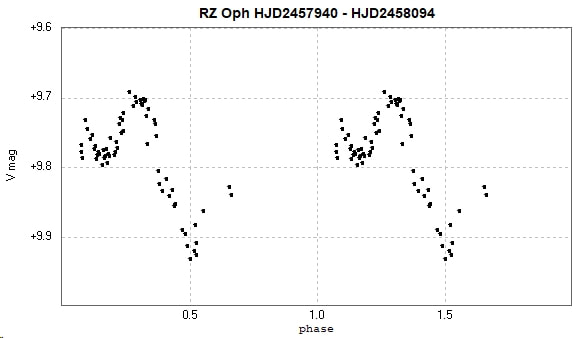
The light curve is evidently not the same during all orbits. The following light curve has been colour coded to show that from each orbit in a different colour.
These have again been combined into a phase diagram, below.
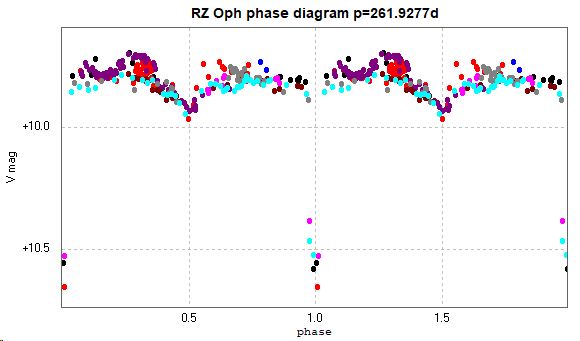
This appears consistent with the light curve itself not being the same for every orbit, rather than being due to some form of scatter in the observations themselves.
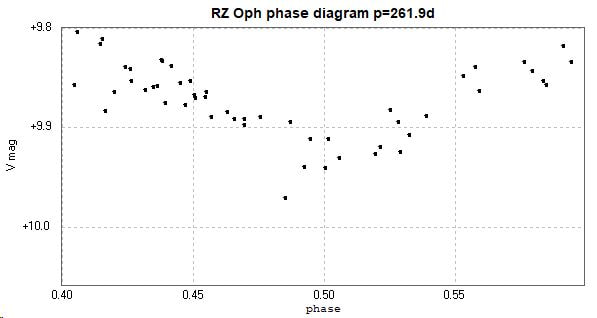
Two plots from the phase diagram in particular show some possibly significant differences, the purple one and the pale blue one. These have been plotted, individually, below. The purple one first, followed by the pale blue one, together with the JD (HJD) of the observations.
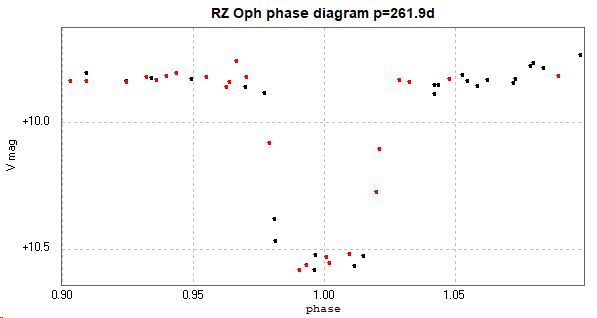
Enlargements of the maximum magnitude sections of both diagrams follow.
A short video illustrating these changes has been posted to YouTube RZ Oph - YouTube
There is little o-c activity evident to date (Kreiner).
The observing runs are arbitrarily defined by calendar dates, and the complex shape of the light curve might yet possibly be due to some form of observational artefact However, it might also be due to astrophysical causes, for example, changes to, or mass transfer via, an accretion disc (rather than Roche Lobe overflow) see for example Baldwin 1978, Paradijs 1982, Knee et al 1986, Olson 1993.
More results from images taken with the Open University COAST telescope will be published here as and when they become available.
[This section updated 2021 January 4.]
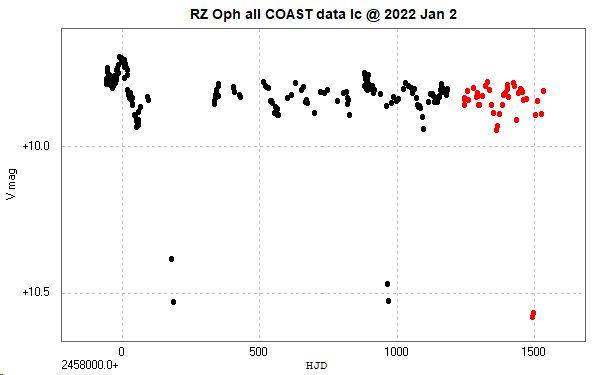
Update added 2022 January 3.
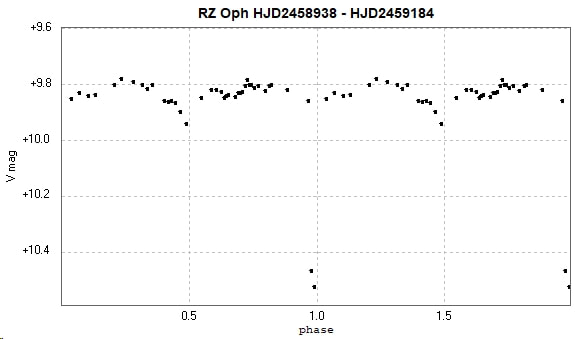
An additional 41 observations have been subsequently made with the COAST telescope. These consist of 26 observations made between 2021 January 29 and 2021 July 9 with the MkII telescope, a C14, and 15 observations made between 2021 July 26 and 2021 November 12 with its replacement a CDK17. The light curve and phase diagram (below) show these in red. Note that these results do not include the BRT results.
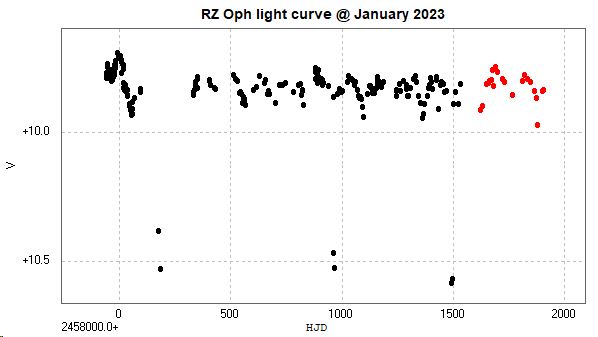
Update added 2023 January 6.
An additional 22 observations have been subsequently made with the COAST telescope. These were made between 2022 February 12 and 2022 November 20 with the current CDK17 telescope. The light curve and phase diagram (below) show these in red.
Update added 2023 December 15
An additional 27 observations have been subsequently made with the COAST telescope. These were made between 2023 February 13 and 2023 December 3 with the current CDK17 telescope. The gap - during a maximum - was due to down-time of the telescope. The light curve and phase diagram (below) show these observations in red.
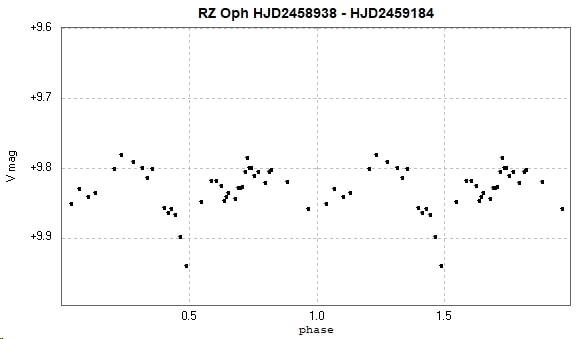
Magnifying the phase scale generates the following diagrams of the two minima. The primary minimum (top) shows a distinct flat minimum, while the secondary minimum is much shallower, and its shape is less clear in the noisy data on this scale.
The catalogue period for this system is 261.9277 days (GCVS, AAVSO VSX, accessed 2023 December 15)
An article discussing this system, Olson (1987), can be found here.
This object remains on my COAST program awaiting more observations.
[Page updated 2023 December 15]
