
V505 Monocerotis / V505 Mon
Light curves and phase diagram of the EB type eclipsing binary V505 Monocerotis / V505 Mon.
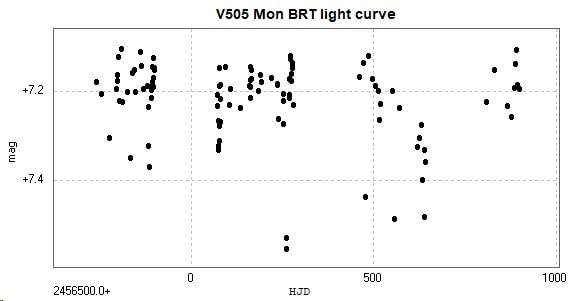
The first light curve is constructed from photometry of 109 images taken with the Bradford Robotic Telescope Cluster Camera (BRT) between 2012 November 9 and 2016 January 11 through a tri-colour 'green' filter.
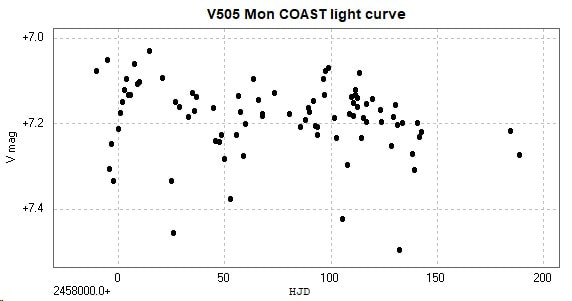
The next light curve is constructed from photometry of 88 images taken with the Open University COAST telescope (a 14 inch Schmidt-Cassegrain) between 2017 August 24 and 2018 March 11 through a V filter.
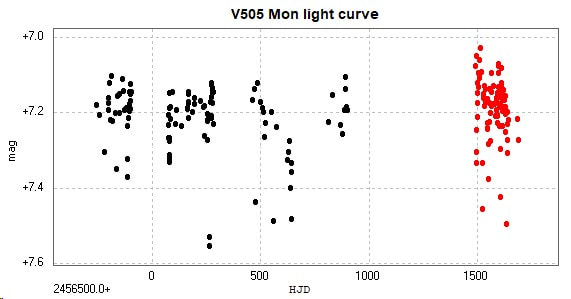
Combining the two sets of data results in the following light curve and phase diagram, BRT data in black, COAST data in red.
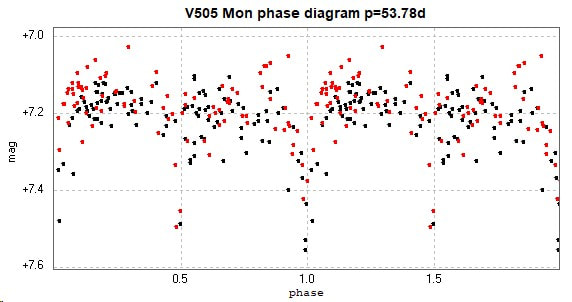
For clarity, a plot of the phase diagram in black and white is shown below;
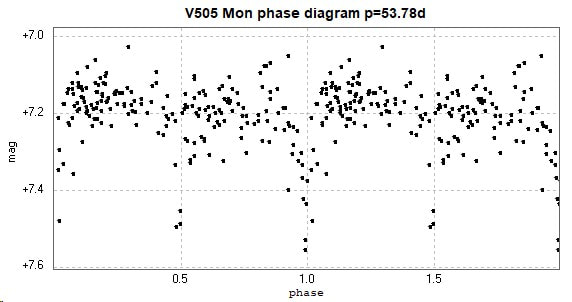
The catalogued period for this star is given as 53.7805d (GCVS, AAVSO VSX) and 53.770074d (Kreiner). There are too few observations recorded to indicate any significant o-c activity (Kreiner). [Accessed 2018 October 26.]
Although the amplitude of variation due to eclipses is small, the relatively large and eratic scatter in data points might be due to variations (due to pulsations or rotation of one of the spectral class B components), see e.g. Chochol et al 1985.
[This page updated 2018 October 26.]
