
SX Aurigae / SX Aur
Light curves and phase diagrams of the EB type eclipsing binary SX Aurigae / SX Aur
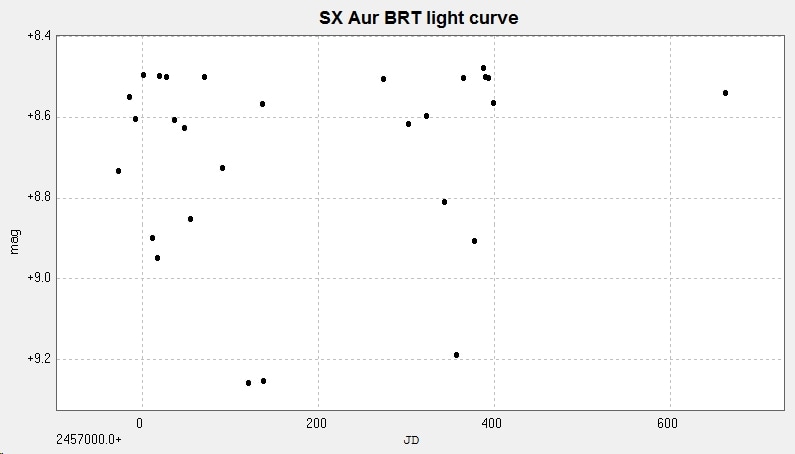
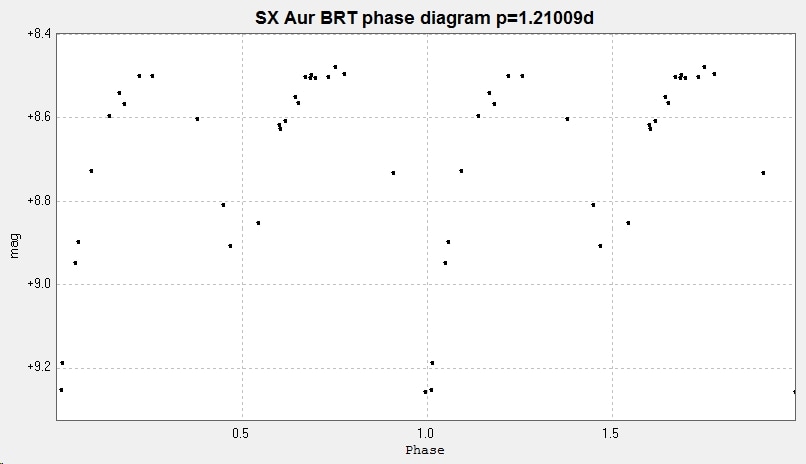
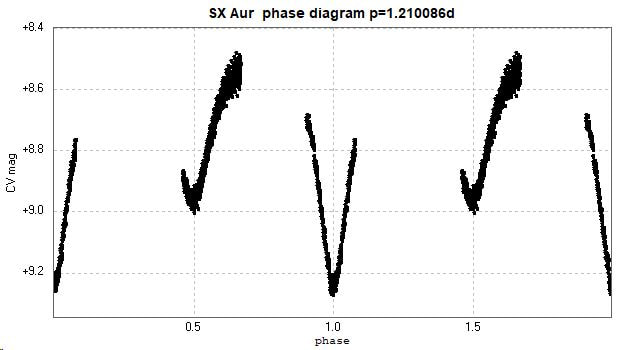
This light curve and phase diagram are constructed from photometry of 28 images taken with the Bradford Robotic Telescope Cluster Camera (BRT) between 2014 November 11 and 2016 October 1. The images were taken through their tri-colour green filter.
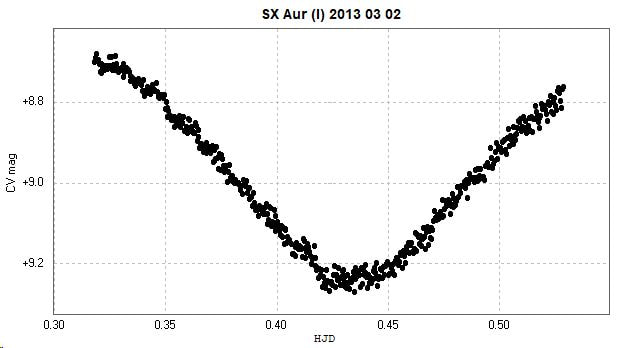
A primary minimum was observed on 2013 March 2 from Somerby Observatory using the 2" Titan camera. The images were unfiltered.
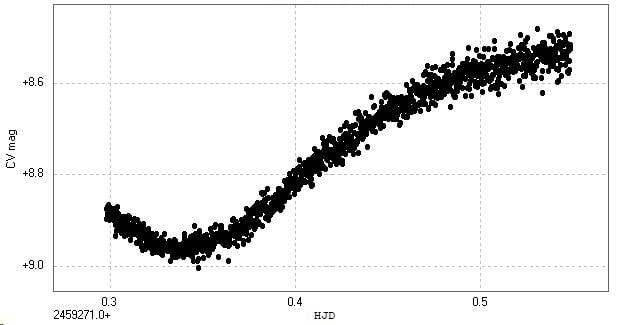
A secondary minimum was observed from Somerby Observatory using the 2" Titan on 2021 February 25. The images were unfiltered.
These two minima were combined into the following phase diagram, using the current GCVS value for the period.
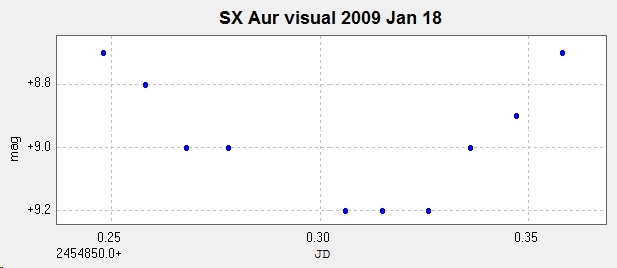
This visual primary minimum was observed from Somerby using 15x80 binoculars in 2009.
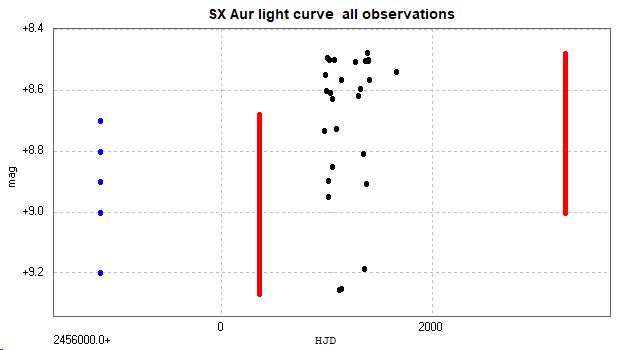
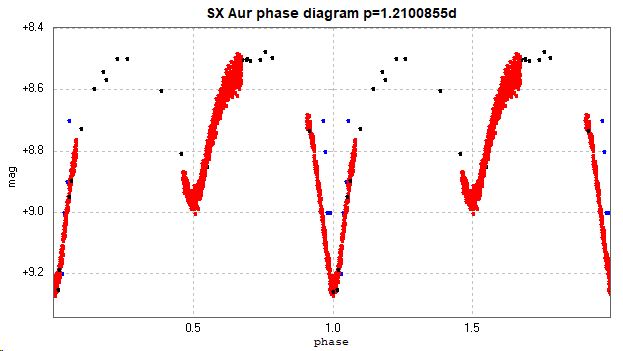
Combining all three sets of observations generated the following light curve and phase diagram. The visual observations are in blue, BRT in Black and Somerby (2" Titan) in red.
There is o-c activity in this system.
The catalogued period is variously given as 1.2100855d (GCVS, Kreiner) and 1.21008312d (AAVSO VSX).
(Accessed 2021 March 8.)
The catalogued period is variously given as 1.2100855d (GCVS, Kreiner) and 1.21008312d (AAVSO VSX).
(Accessed 2021 March 8.)
[ This page updated 2021 March 8 ]
