
EG Cephei / EG Cep
Light curves and phase diagrams of the EB type eclipsing binary EG Cephei / EG Cep.
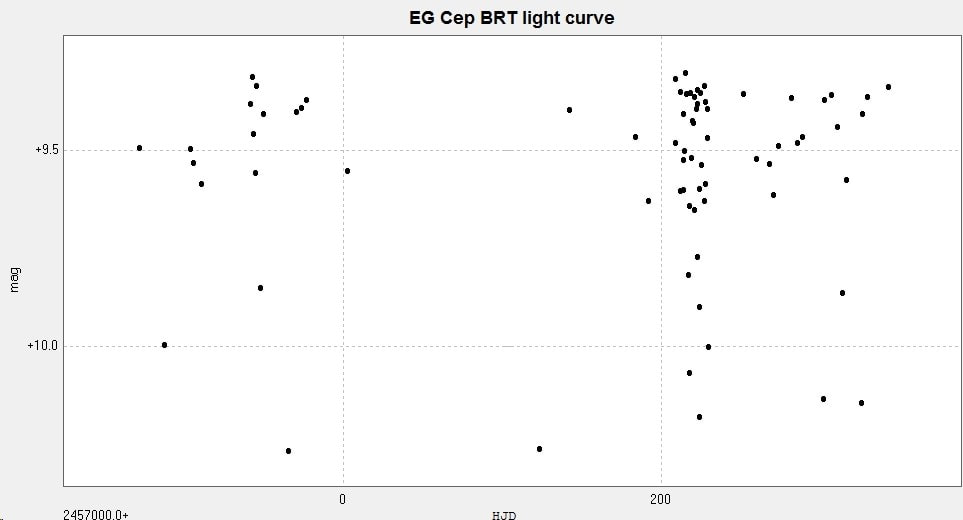
Light curve of EG Cep generated from 74 images taken with the Bradford Robotic Telescope Cluster Camera (BRT) between 2014 Aug 08 to 2015 Nov 11 through its tri-colour green filter.
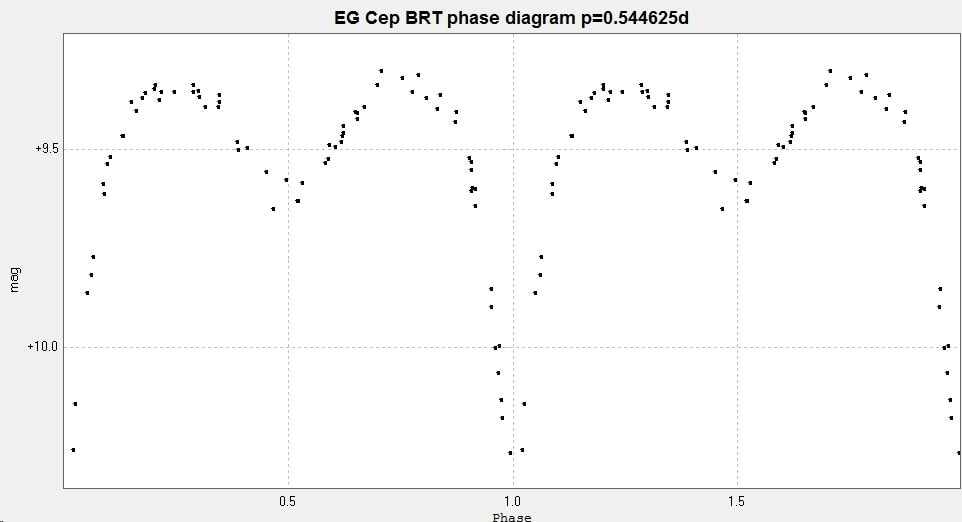
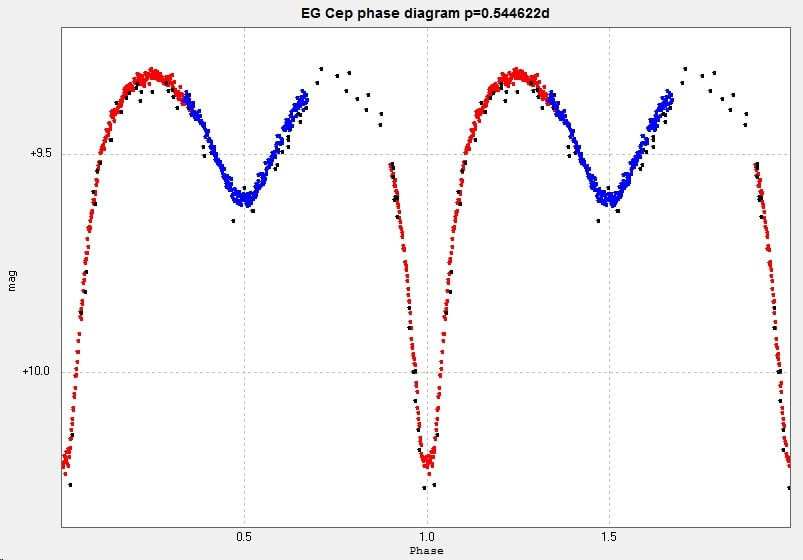
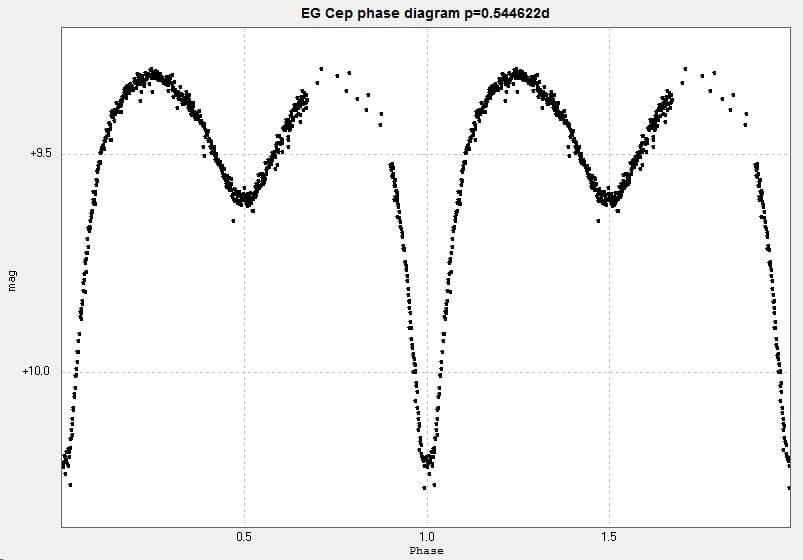
When plotted with a period of 0.544625 days the following phase diagram is generated.
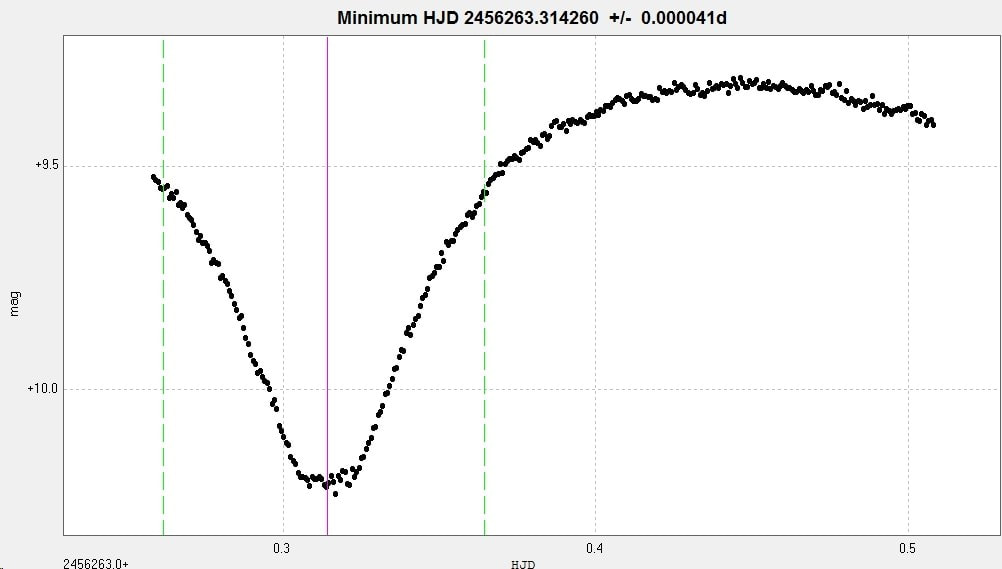
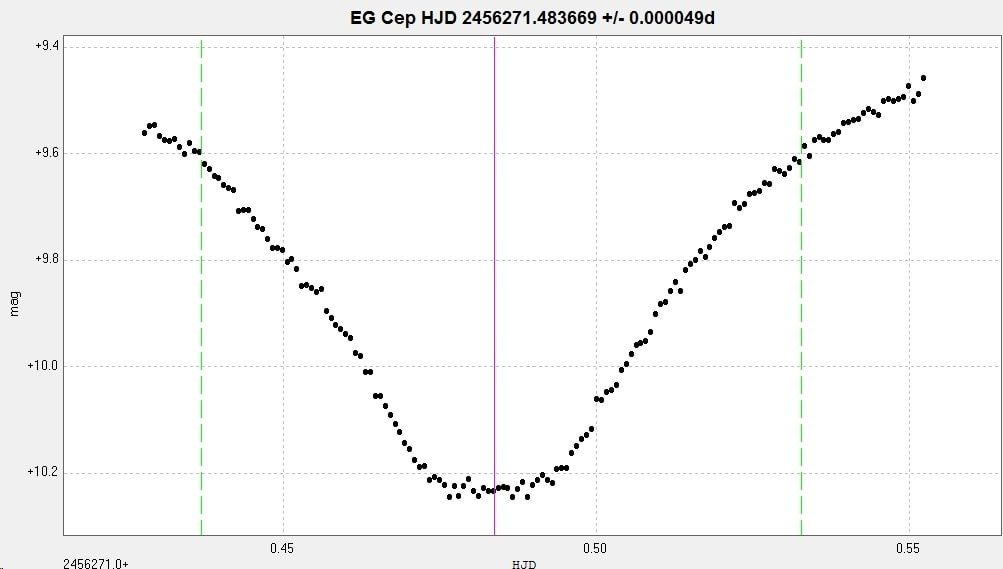
Two primary minima observed in December 2012 with the 2" Titan at Somerby Observatory, with corresponding HJD times of minima. (Images were unfiltered.)
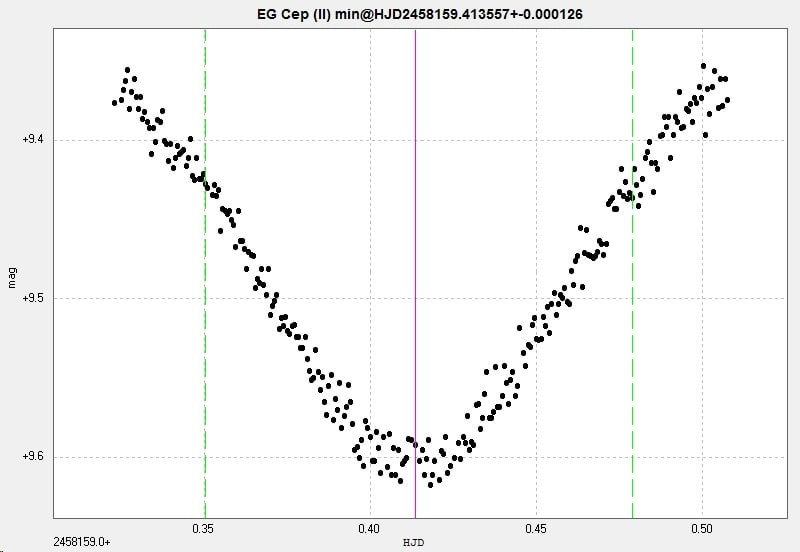
A secondary minimum was observed with the 2" Titan at Somerby Observatory, unfiltered, on 9 February 2018.
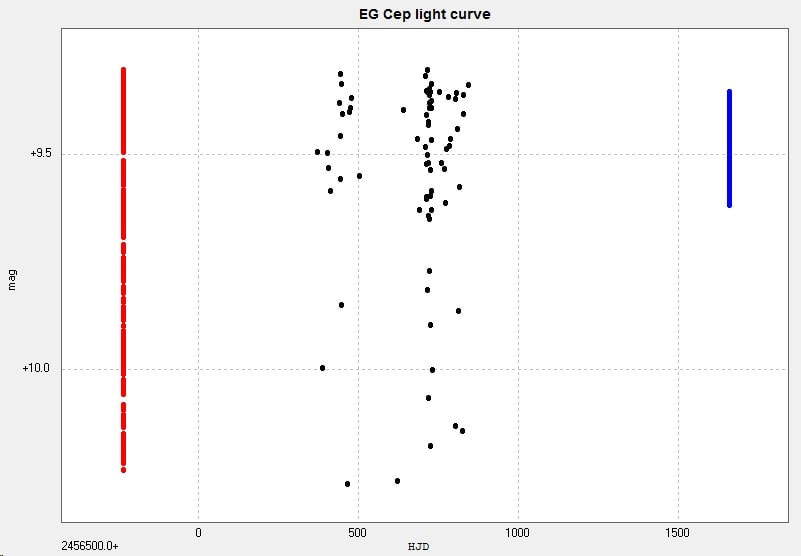
Combining the BRT data with the primary minimum of 1 December 2012 and the secondary minimum of 9 February 2018 generates the following light curve and phase diagram. The BRT data is in black, the primary minimum is in red and the secondary minimum is in blue.
The same phase diagram but in black and white;
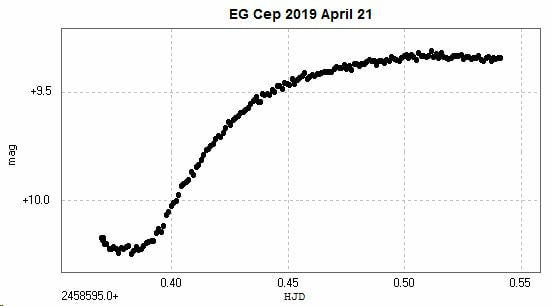
The rise from primary minimum to just past maximum was observed on 2019 April 21 with the 2" Titan at Somerby Observatory. (It didn't go dark soon enough to observe sufficient of the minimum to determine an accurate time of minimum.)
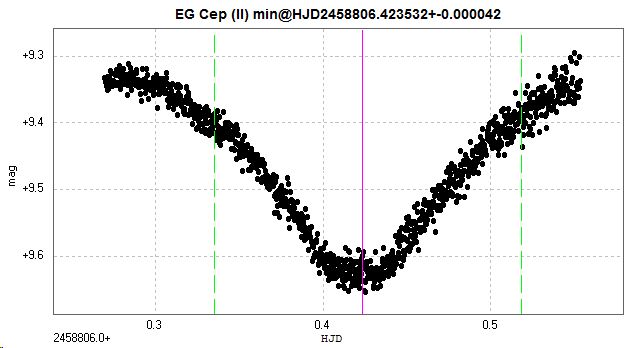
Another secondary minimum, observed from Somerby Observatory with the 2 inch Titan on 2019 November 18. The images were unfiltered.
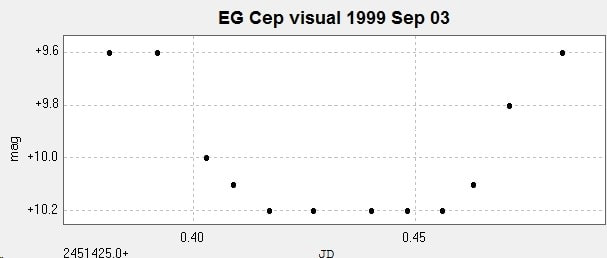
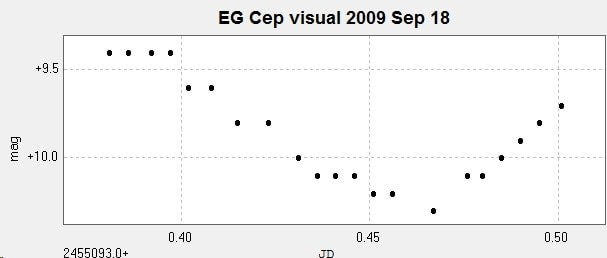
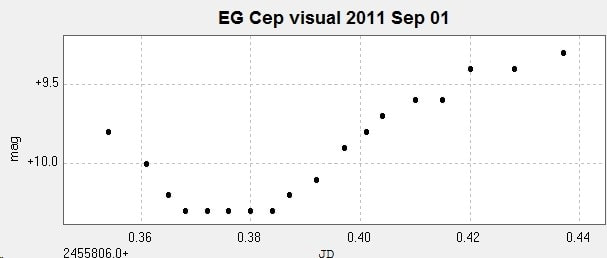
I have observed this star visually a number of times with my 10" Newtonian. The following are the three 'best' minima observations.
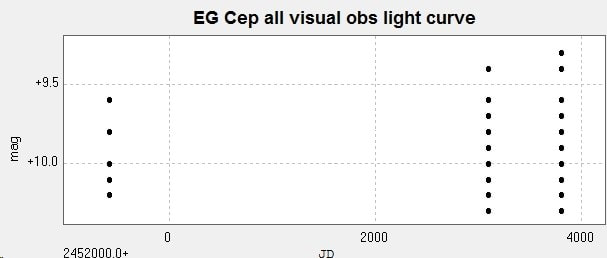
Combining these results in the following light curve and phase diagram.
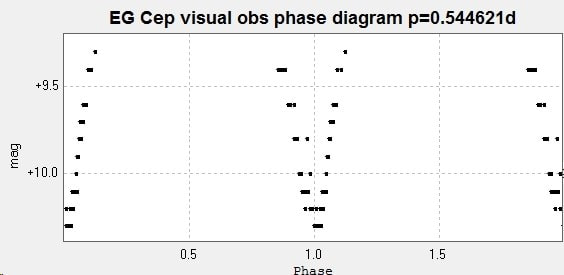
The catalogue values for the period of this system are 0.54462183d (GCVS and AAVSO VSX) and 0.54462150d (Kreiner) (accessed 2017 Feb 23). These values are within 0.13 seconds of my estimates; there is some o-c activity for this system (Kreiner).
[ This page updated 2019 November 22 ]
