
TW Draconis / TW Dra
Light curves and phase diagrams of the EA type eclipsing binary TW Draconis / TW Dra.
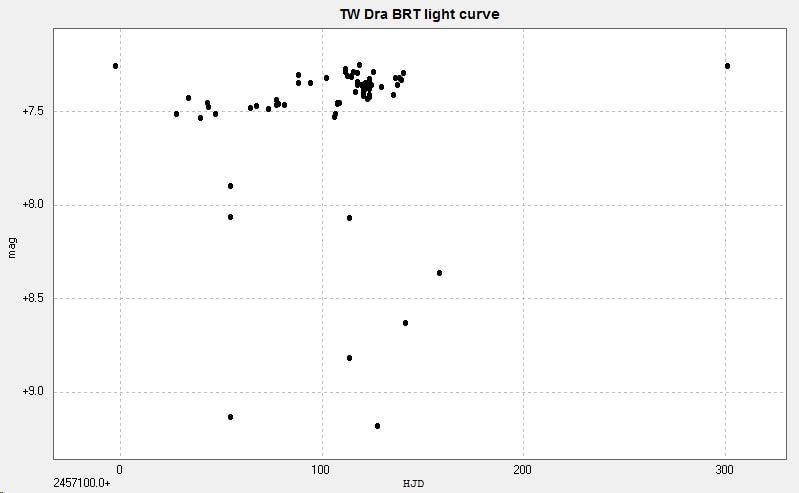
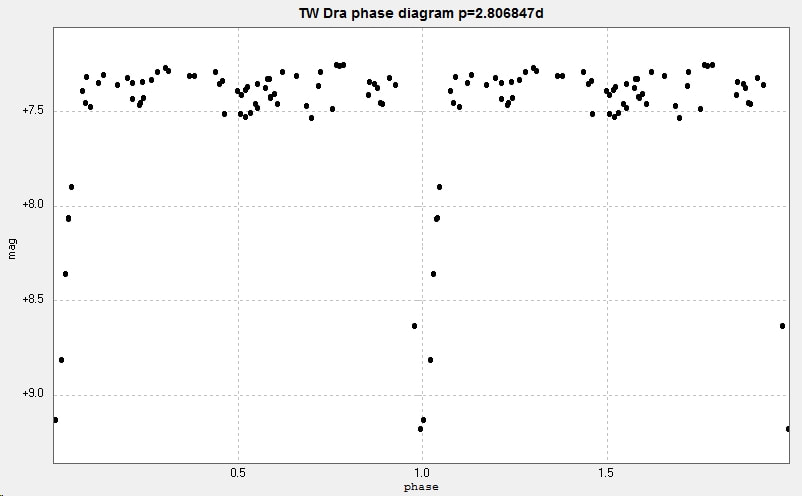
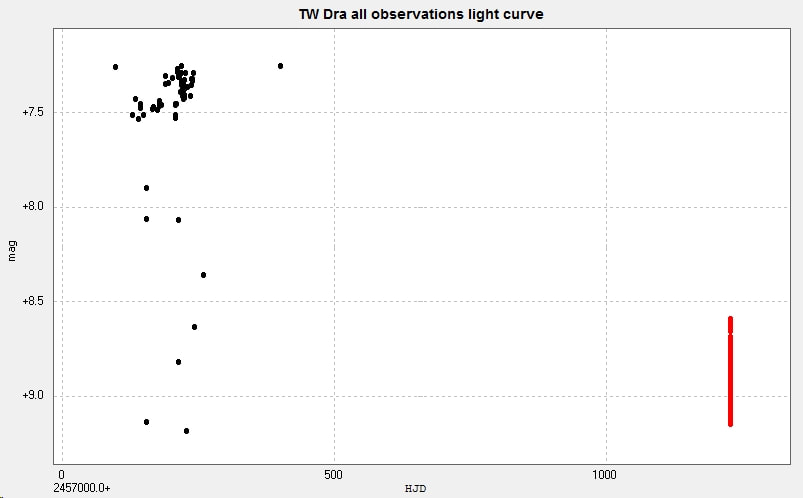
The following light curve and associated phase diagram were constructed from photometry of 65 images taken with the Bradford Robotic Telescope (BRT) Cluster Camera between 2015 March 16 and 2016 January 13. The images were taken through a tri-colour green filter.
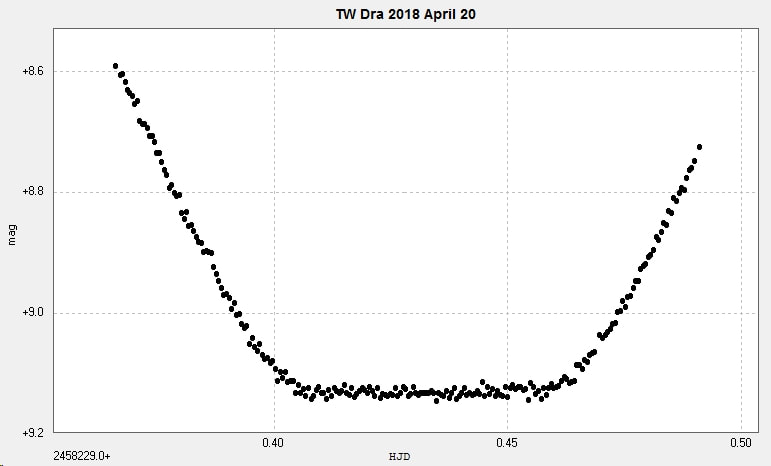
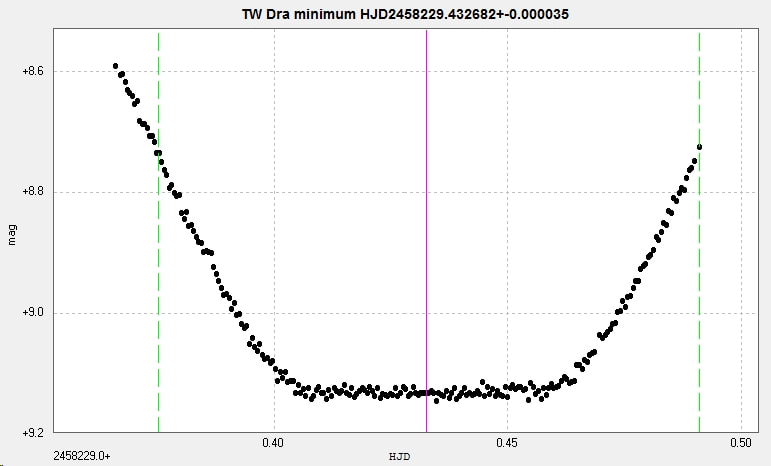
On 2018 April 20 I observed a primary minimum using the 2" Titan at Somerby Observatory. These images were unfiltered. The calculated time of the observed minimum is also shown.
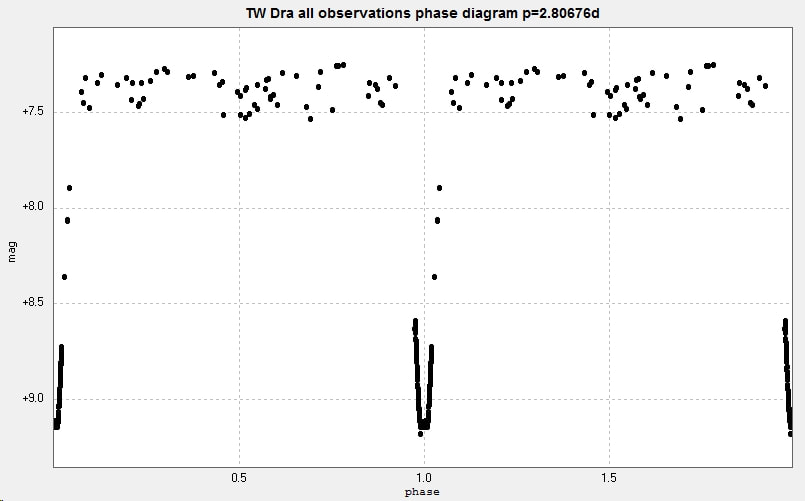
Combining the above sets of data generates the following light curve and phase diagram. The BRT observations are in black while the Somerby observations are in red. (A monochrome phase diagram is also included because it reproduces better.)
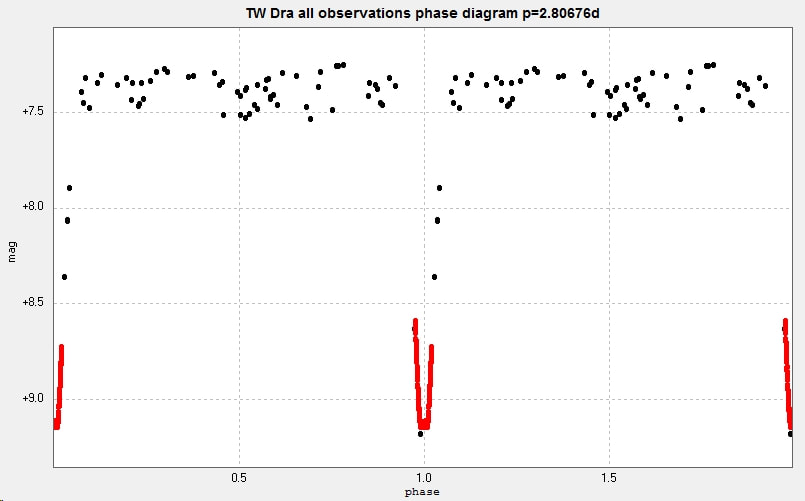
The catalogued period for this star is variously given as 2.806847d (GCVS, AAVSO VSX) and 2.806784d (Kreiner). [Accessed 2018 May 22]
Note that the 'all observations' phase diagram is plotted with a slightly different period to the BRT observations on their own. There is significant O-C activity with this star (Kreiner) which might be responsible this.
[This page updated 2018 May 22]
