
X Trianguli / X Tri
Light curves and phase diagram of the EA type eclipsing binary X Tri.
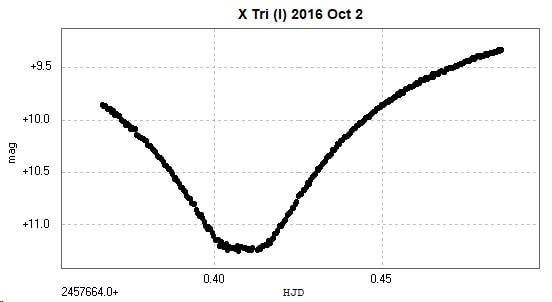
Primary minimum light curve constructed from 253 unfiltered images taken with a 2" object lens and Atik Titan monochrome CCD camera (the 2" Titan)from Somerby Observatory, Melton Mowbray, UK on 2016 October 2.
Photometry in AIP4WIN.
The results have not been transformed.
Photometry in AIP4WIN.
The results have not been transformed.
Time of minimum.
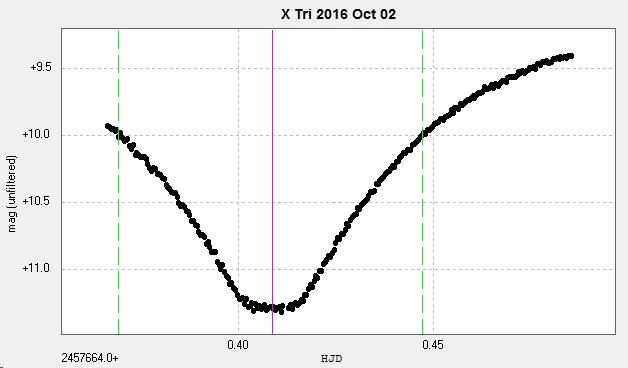
The heliocentric time of this primary minimum is HJD 2457664.408705 +/- 0.000024d (Kwee-van Woerden)
The computed time from Krakow was HJD 2457664.40691 using HJD = 2452500.7324 + E x 0.9715286
This give an o-c of 0.08059 d,
However, using the elements which from which Krakow's o-c curve is generated (Min at HJD 2422722.285 and p=0.9715341d) the computed time of minimum was HJD 2457664.48044. This gives an o-c value of -0.071735d. This is consistent with the Krakow o-c curve [ http://www.as.up.krakow.pl/minicalc/TRIX.HTM ] (accessed 2016 October 2)
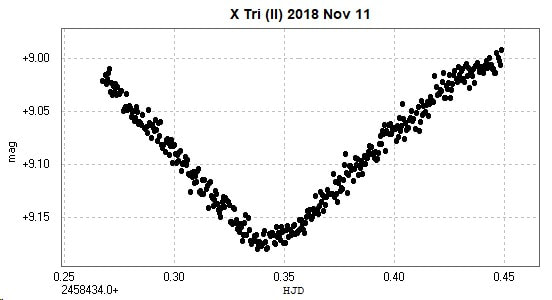
Secondary minimum light curve observed from Somerby Observatory on 2018 November 11, also with the 2" Titan, constructed from photometry of 379 unfiltered images.
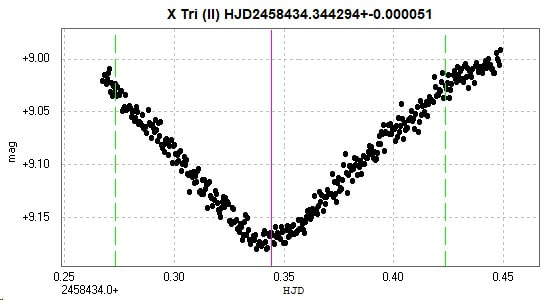
Time of minimum.
Another secondary minimum was observed with the unfiltered 2" Titan on 2021 November 4. Note, this light curve was obtained by using comparisons which generated the 'accepted' value of the minimum magnitude (mag 9.07), unlike the 2018 November 11 minimum. One of the issues with unfiltered and untransformed observations which needs to be investigated further with this system in due course.
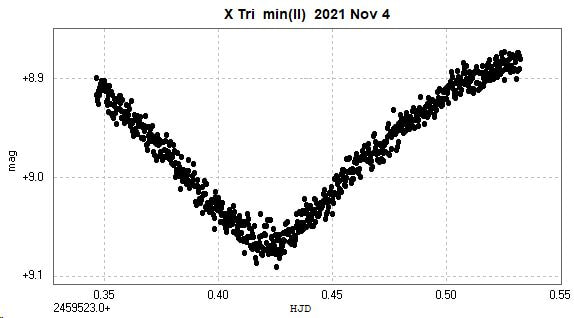
Time of minimum.
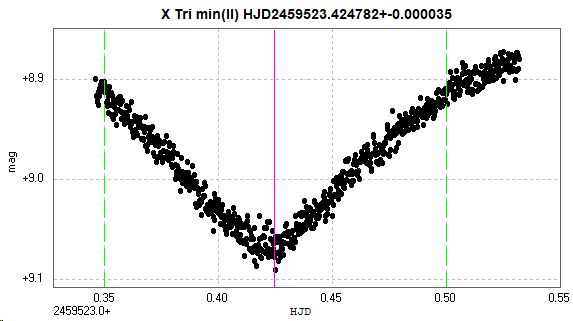
The time of this secondary minimum was calculated in Peranso to be HJD 2459523.424782 +- 0.000035.
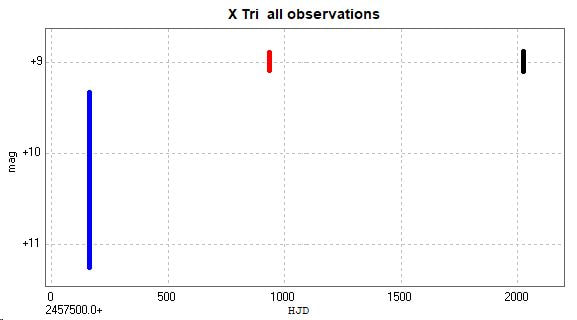
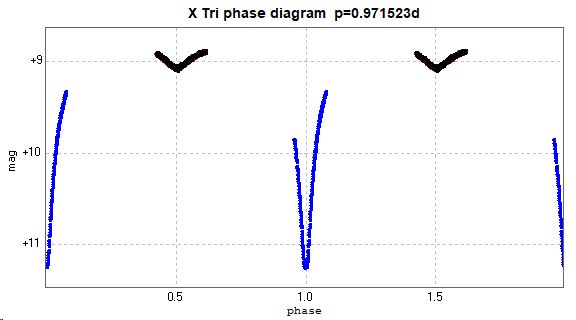
Combining the above minima generated the following light curve and phase diagram. Here, the 2016 primary minimum is in blue, the 2018 secondary minimum is in red, and the 2021 secondary minimum is in black. In the phase diagram, the 2018 minimum is hidden behind the 2021 minimum.
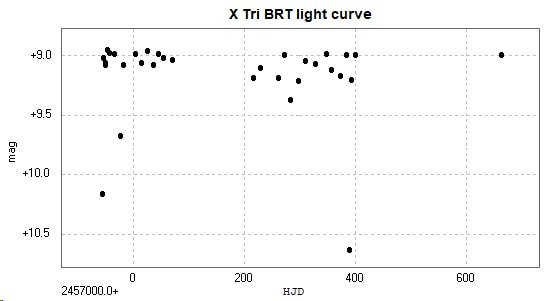
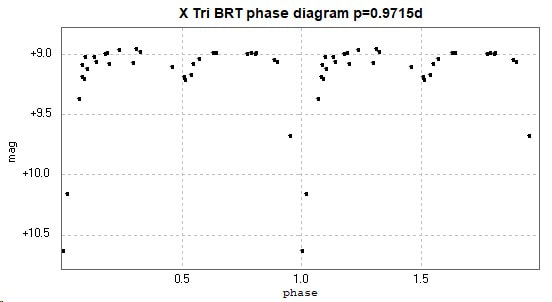
The following light curve and phase diagram were constructed from photometry of 32 images taken with the Bradford Robotic Telescope Cluster Camera (BRT) between 13 October 2014 and 1 October 2016 through their tricolour green filter.
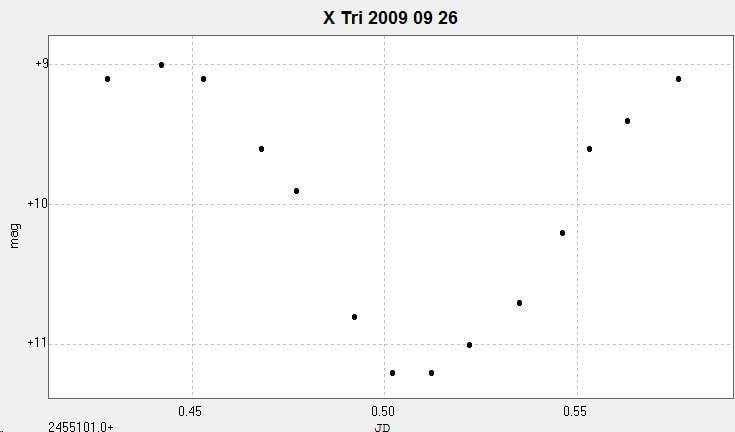
This is a minimum observed visually from Somerby with my 14 inch / 356mm Dobsonian reflector on 26 September 2009.
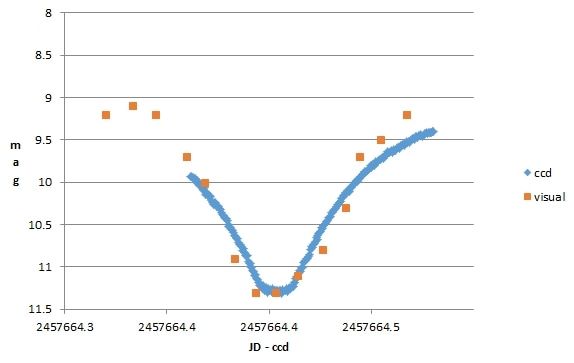
This visual result is compared to the Somerby ccd observations below. The visual curve was reduced in brightness by 0.1 mag to more closely fit the ccd results, but the shape of the two curves is encouraging, suggesting that visual observations still have a valuable place in variable star work.
Discussion
The catalogue values for the period are currently 0.9715352d (GCVS, AAVSO VSX, Kreiner). (Accessed 2021 November 17).
There is considerable o-c activity with this star (Kreiner). Kreiner uses the above value in their table of eclipsing binaries in Triangulum, but a value of 0.9715250 to calculate its ephemeris (accessed 2021 November 17).
J.M. Kreiner, 2004, Acta Astronomica, vol. 54, pp 207-210.
There is considerable o-c activity with this star (Kreiner). Kreiner uses the above value in their table of eclipsing binaries in Triangulum, but a value of 0.9715250 to calculate its ephemeris (accessed 2021 November 17).
J.M. Kreiner, 2004, Acta Astronomica, vol. 54, pp 207-210.
Using the values of period and epoch used by Kreiner to generate their o-c curve (period = 0.971532583d and epoch = HJD 2422722.3104), the following o-c values were obtained for my three minima and plotted in the accompanying graph.
Minimum HJD o-c
Min(I) 2016 Oct 2 2457664.408705 -0.042575
Min(II) 2018 Nov 11 2458434.344294 -0.046558
Min(II) 2021 Nov 4 2459523.424782 -0.054096
Min(I) 2016 Oct 2 2457664.408705 -0.042575
Min(II) 2018 Nov 11 2458434.344294 -0.046558
Min(II) 2021 Nov 4 2459523.424782 -0.054096
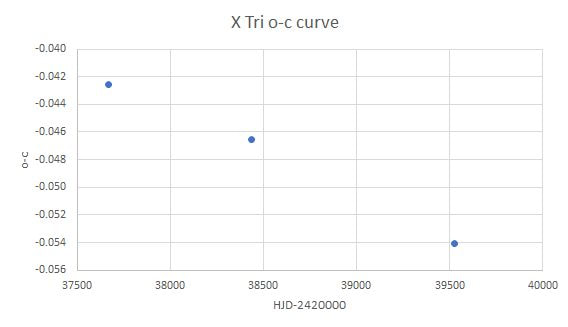
These are consistent with the values suggested by the Kreiner o-c curve.
[ This page updated 2021 November 17 ]
