
KU Cygni / KU Cyg
Light curves and phase diagrams of the EA type eclipsing binary KU Cygni / KU Cyg. The most recent observations appear first, followed by an analysis of earlier observations of this system.
Update 2024 February 8
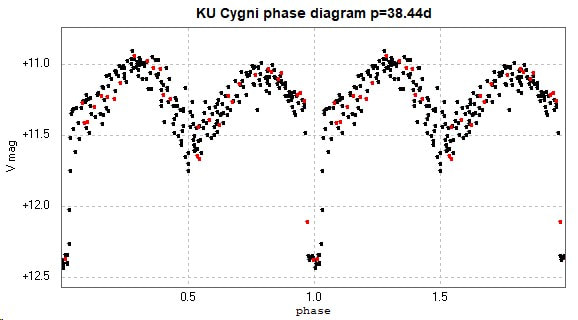
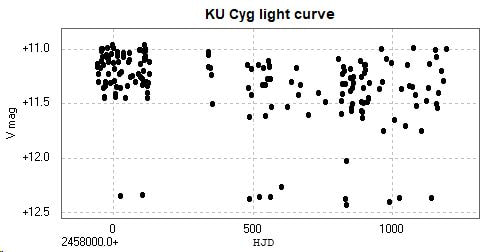
The following light curve and phase diagrams were constructed from photometry of 286 images, taken with the Open University COAST telescope using a V filter, between 2017 July 7 and 2024 February 7. The latest results, since 2023 January 1, are in red.
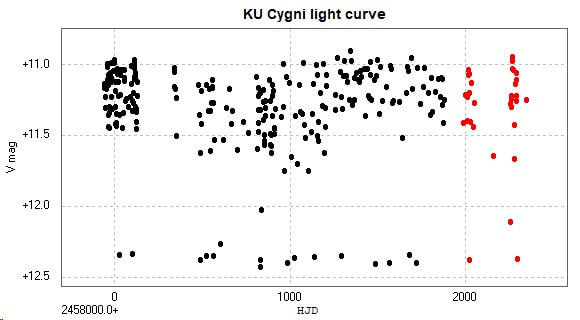
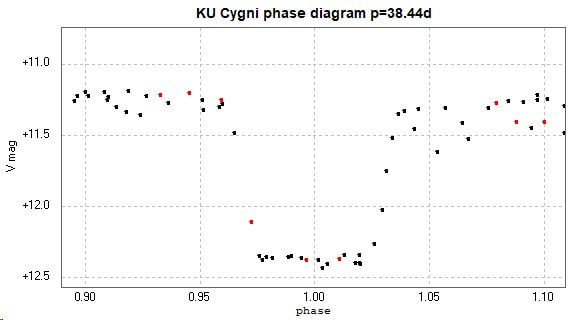
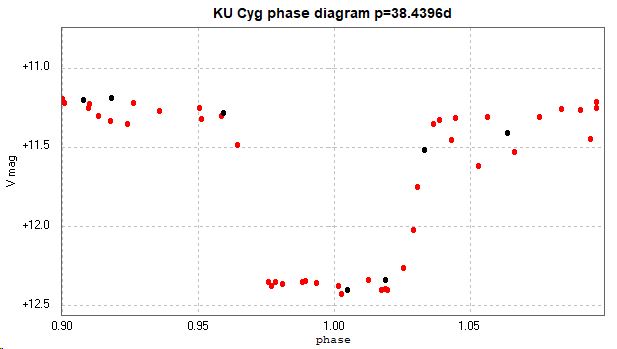
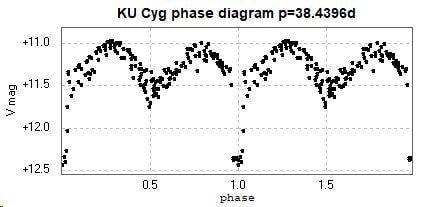
An enlargement of the primary minimum appears below.
Variations out of eclipse variations might be due to luminosity changes in an eccentric accretion disc (Otero 2011).
Papers about this system include Popper (1964), Olson, Etzel and Dewey (1995) and Smak and Plavec (1996). Precession of an eccentric disc around one of the components has been suggested by Smak and Plavec.
Papers about this system include Popper (1964), Olson, Etzel and Dewey (1995) and Smak and Plavec (1996). Precession of an eccentric disc around one of the components has been suggested by Smak and Plavec.
The catalogue period for this star is given as 38.4393d (GCVS) and 38.4396 (AAVSO VSX). The spectrum is variously listed as F4p+K5eIII (GCVS) and B7:V+K5IIIe (AAVSO VSX) (!) (Accessed 2024 February 8.)
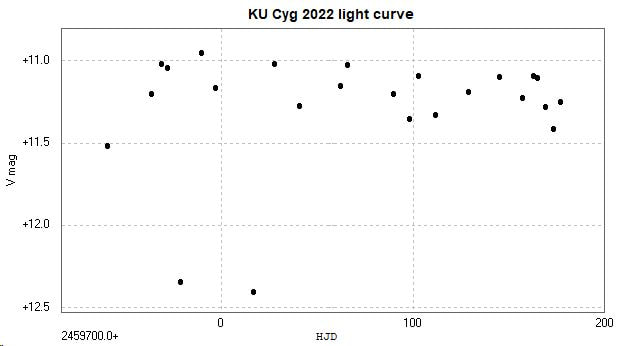
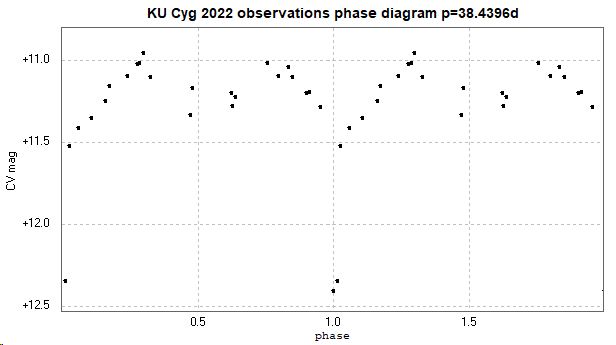
Observations 2022 March 2 to 2022 October 23
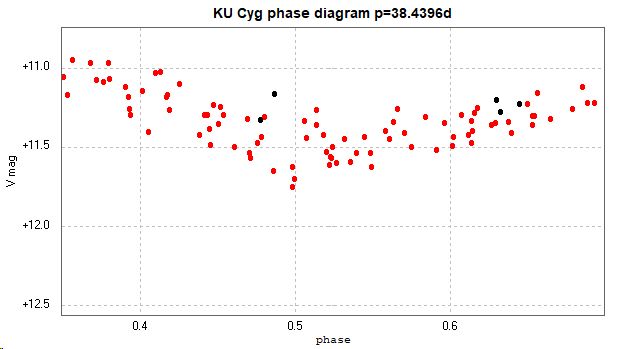
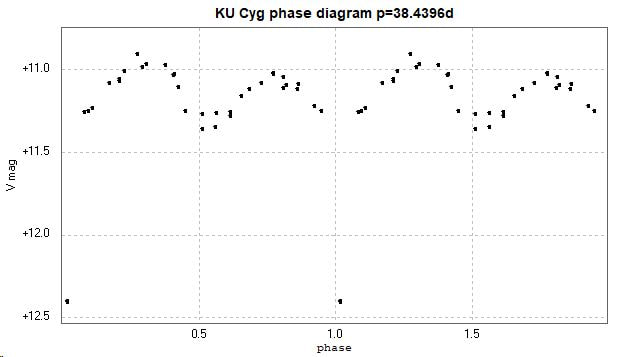
The following light curve and phase diagram were constructed from photometry of 24 images taken by the Open University COAST telescope between 2022 March 2 and 2022 October 23, through a V filter.
The following light curve and phase diagram were constructed from photometry of 24 images taken by the Open University COAST telescope between 2022 March 2 and 2022 October 23, through a V filter.
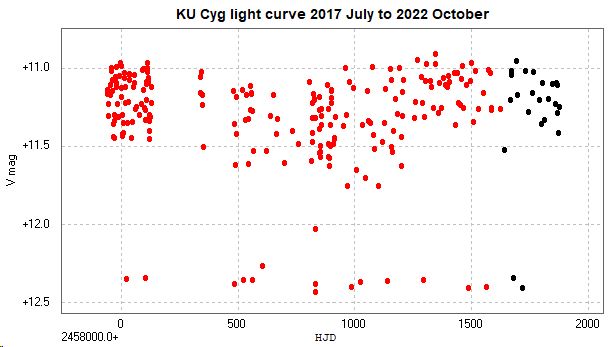
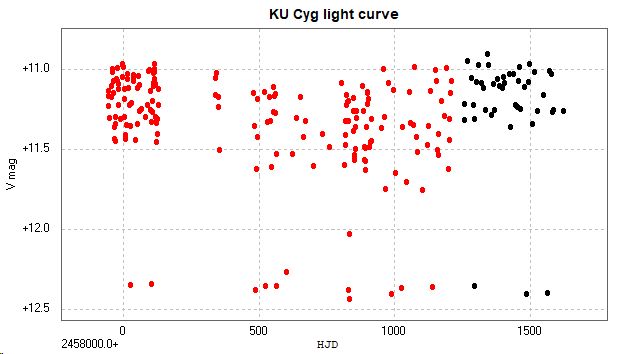
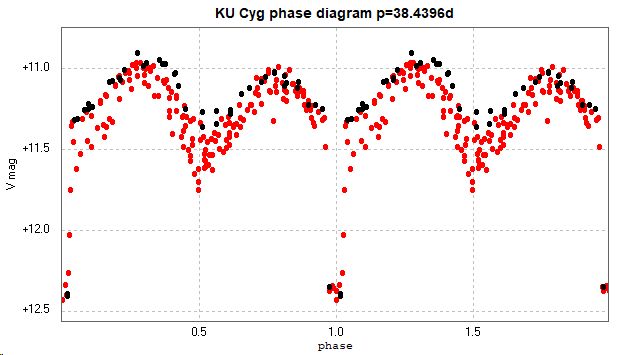
The following light curve and phase diagram consist of all my available observations of this system, with the above 2022 data in black and the previous results in red. It will be seen that the value of the maximum magnitude itself appears to be variable with a very approximate possible period of about 1200 days, assuming that it is periodic and not random fluctuation.
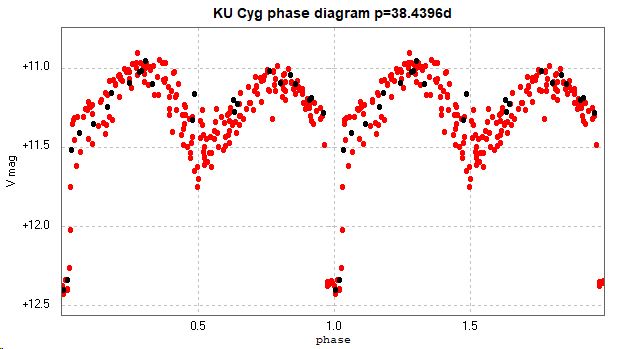
Also, the primary minimum has a flat minimum whereas the secondary minimum does not - note the different x-axis scales in the following diagrams, in case the secondary minimum is not at phase 0.5.
Observations 2021 April 17 to 2022 February 12
The following light curve and phase diagram were constructed from photometry of 35 images taken by the Open University COAST telescope between 2021 April 17 and 2022 February 12, through a V filter.
The following light curve and phase diagram were constructed from photometry of 35 images taken by the Open University COAST telescope between 2021 April 17 and 2022 February 12, through a V filter.

Analysis archive as of March 2022
Comparison with previous observations
To date, I have obtained a total of 229 magnitude estimates of this system, between 2017 July 7 and 2022 February 12.
The following light curve and phase diagram show the above observations in black together with all the previous observations in red.
Comparison with previous observations
To date, I have obtained a total of 229 magnitude estimates of this system, between 2017 July 7 and 2022 February 12.
The following light curve and phase diagram show the above observations in black together with all the previous observations in red.
Analysis of some previous observations
The light curve reduces by approximately 0.1 magnitude between observations made on JD 2458024.7 (2017 September 28) and JD 2458029.4 (2017 October 2). See here on this website for a discussion which suggests that this change is real and not due to instrumental of other factors. If real, it may be due to star spots and/or a disc or stream of material between the two stars, see below.
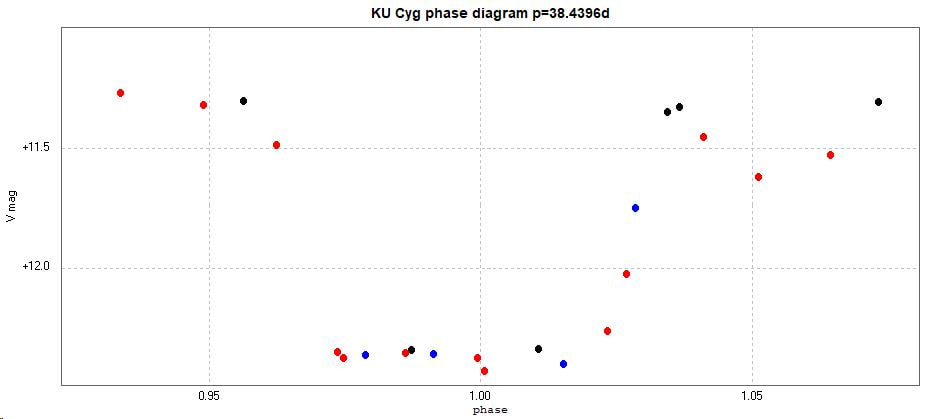
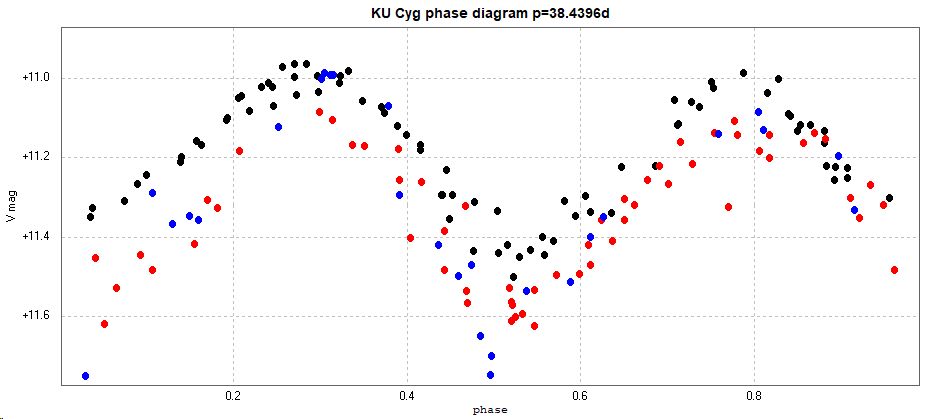
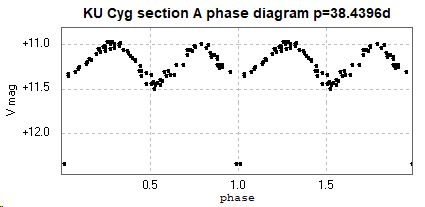
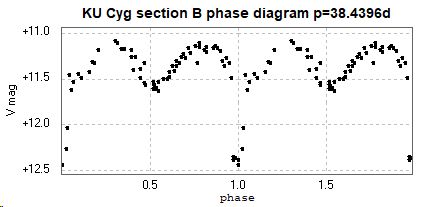
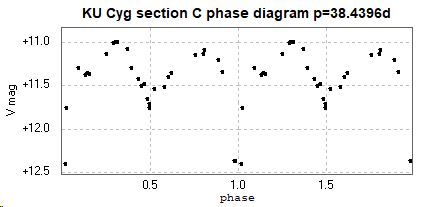
A phase diagram constructed from these observations is below, with the catalogue period of 38.4396d being used.
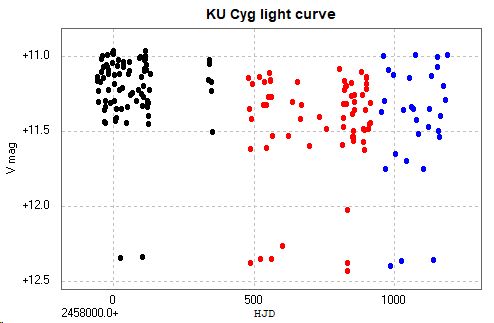
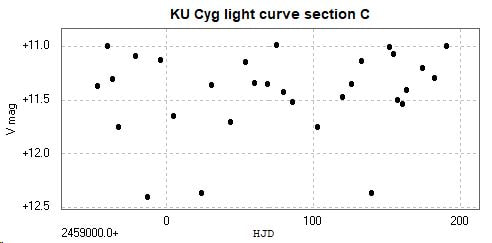
The observations were spit into 3 sections, according to the magnitude at maximum, and the light curve and phase diagram again plotted using the colours listed below.
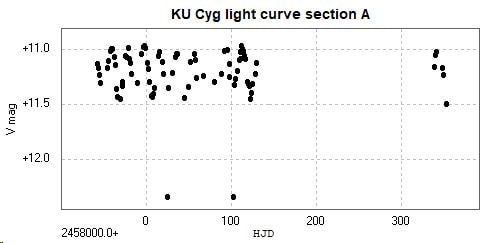
Section A 83 observations 2017 July 7 (JD2457942) to 2018 August 22 (JD2458352) mag~11.0 black
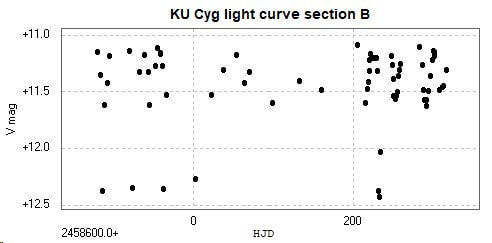
Section B 67 observations 2018 December 26 (JD2458479) to 2020 March 7 (JD2458915) mag~11.1 red
Section C 30 observations 2020 April 13 (JD2458952) to 2020 December 6 (JD2459190) mag ~11.0 blue
Section A 83 observations 2017 July 7 (JD2457942) to 2018 August 22 (JD2458352) mag~11.0 black
Section B 67 observations 2018 December 26 (JD2458479) to 2020 March 7 (JD2458915) mag~11.1 red
Section C 30 observations 2020 April 13 (JD2458952) to 2020 December 6 (JD2459190) mag ~11.0 blue
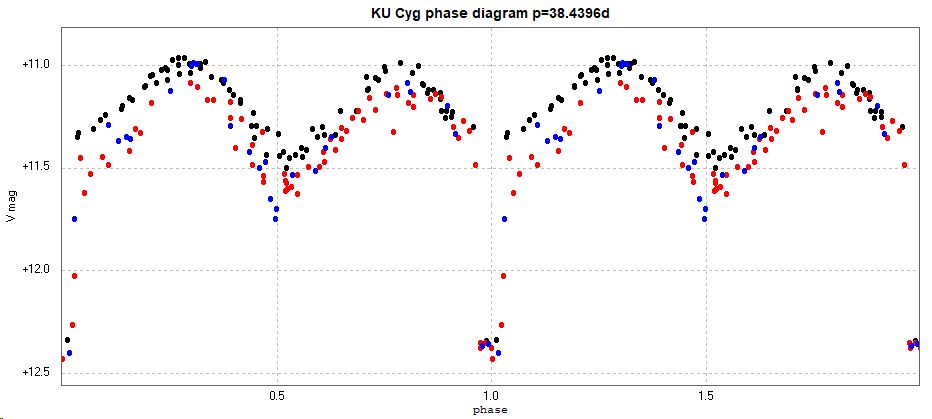
Superficially, from these limited observations, it appears that there is less reduction in brightness between phase 0.75 and phase 1 than for the rest of the phase diagram, especially coming out of the primary eclipse.
Enlargements of the primary and secondary eclipses are below.
Enlargements of the primary and secondary eclipses are below.
The three sections of the light curve are plotted separately below.
|
|
Variations out of eclipse variations might be due to luminosity changes in an eccentric accretion disc (Otero 2011).
Papers about this system include Popper (1964) and Olson, Etzel and Dewey (1995).
Papers about this system include Popper (1964) and Olson, Etzel and Dewey (1995).
More observations of this star will be made to investigate any further activity.
The catalogue period for this star is given as 38.4393d (GCVS) and 38.4396 (AAVSO VSX). The spectrum is variously listed as F4p+K5eIII (GCVS) and B7:V+K5IIIe (AAVSO VSX) (!) (Accessed 2023 January 29.)
[ This page updated 2024 February 8 ]
