
CQ Aurigae / CQ Aur
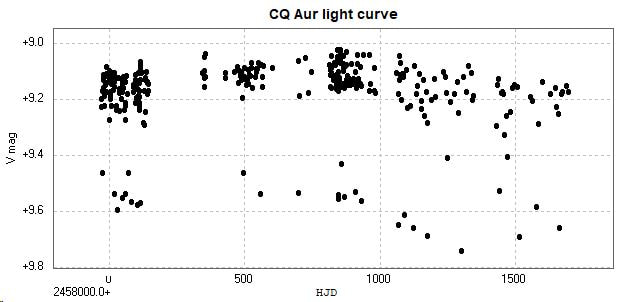
Light curves and phase diagrams of the EA/RS type eclipsing binary CQ Aurigae/ CQ Aur.
Note that this page is in chronological order; more recent observations can be found towards the end as 'updates'.
The following light curve and phase diagram were constructed from photometry of 240 images taken with a V filter with the Open University COAST telescope (a 14 inch Schmidt- Cassegrain) between 2017 August 3 and 2020 May 12.
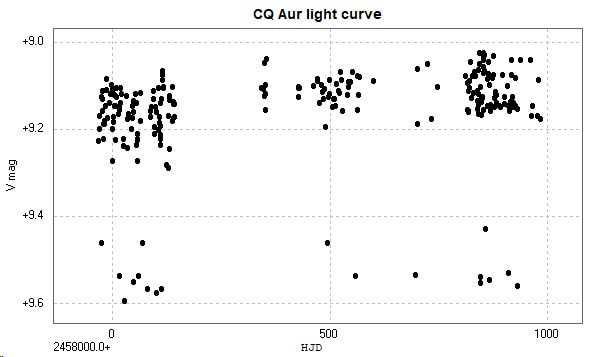
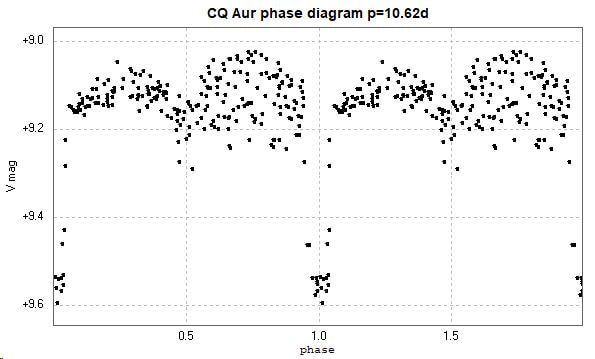
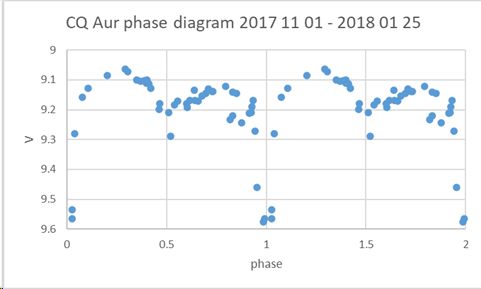
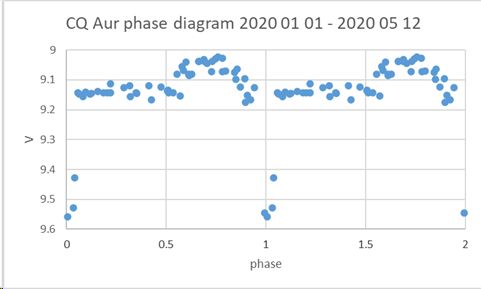
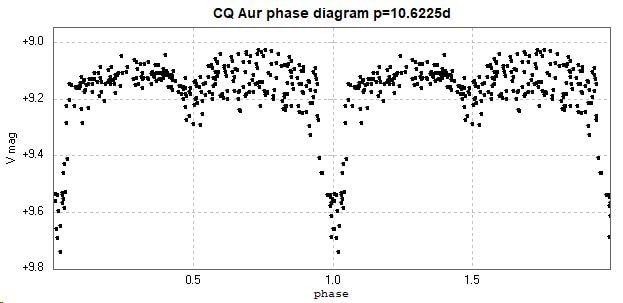
The light curve is changing over time, and the phase diagram is asymmetrical and 'noisy', the maximum between secondary and the primary minima showing more 'scatter' than that between the primary and the secondary minima. This apparent scatter is caused by changes to the light curve over time, with corresponding changes to the corresponding phase diagrams. The following 4 phase diagrams show this effect.
|
|
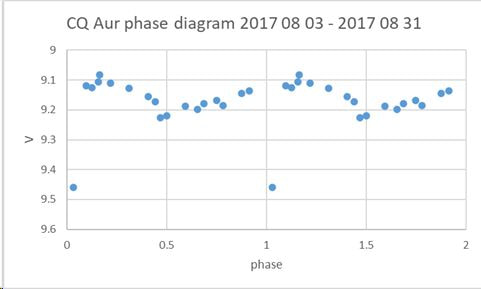
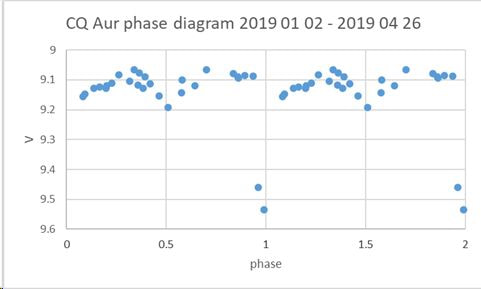
These suggest that, at least for the duration of these particular observations, that the maximum between phase 0 and phase 0.5 changes shape a little without much change in overall magnitude, while the maximum between phase 0.5 and phase 1 not only changes shape but also increases somewhat in magnitude.
This effect can be seen on the following colour coded charts.
2021 February 3 update
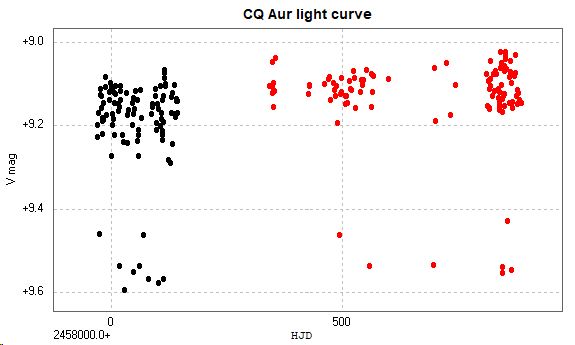
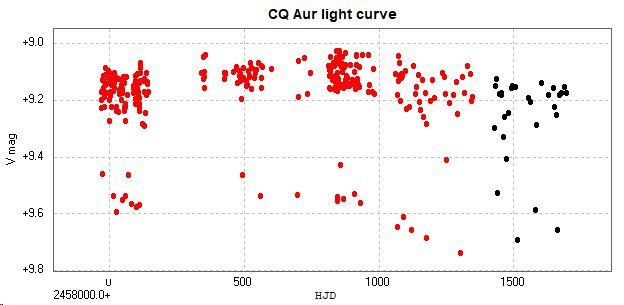
A further 33 images were obtained with the COAST telescope between 2020 July 31 and 2021 February 1, with a V filter. The following light curve and phase diagram show these as red, while all the other data points discussed above are in black.
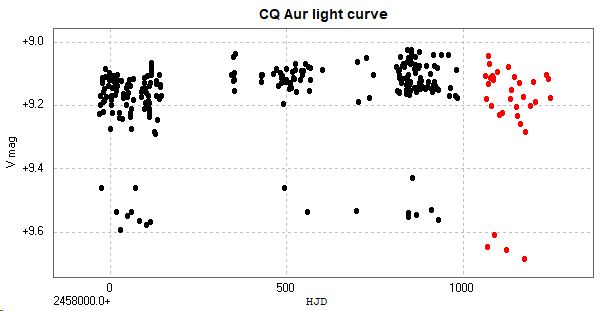
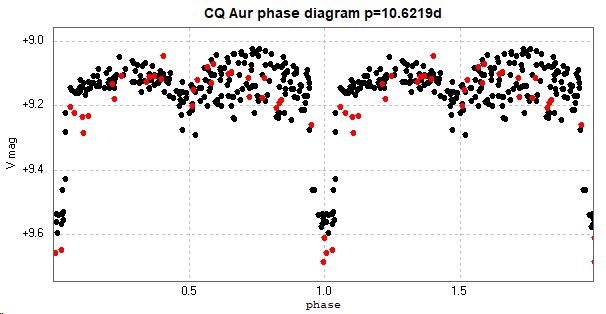
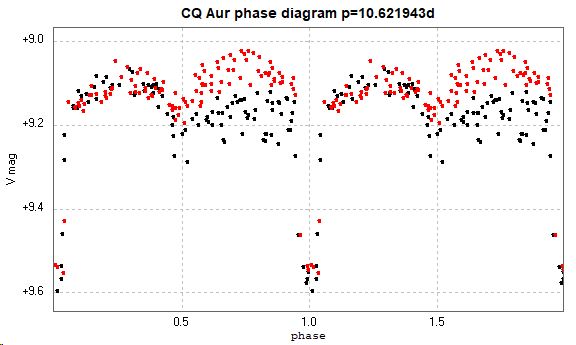
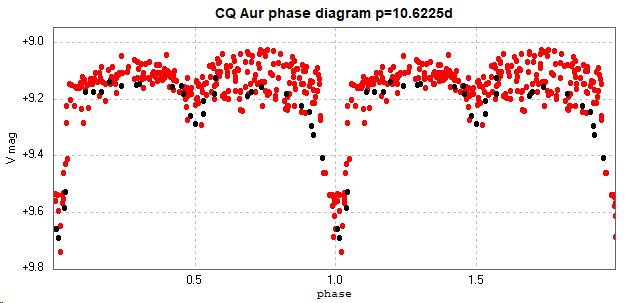
The variation in maximum light is consistent with the behaviour previously discussed. However, the primary minima (each red data point is from a different minimum) are significantly fainter than previous minima by about half a magnitude. There is also possibly some widening of the top of the primary eclipse.
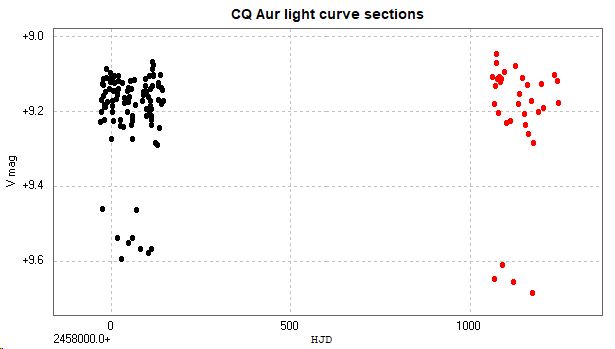
This is illustrated in the following light curve sections and the corresponding phase diagram. Two sections of the light curve were selected;
101 data points from 2017 August 3 (JD2457969) to 2018 January 25 (JD2458144), shown in black.
33 data points from 2020 July 31 (JD2459062) to 2021 February 1 (JD2459247), shown in red.
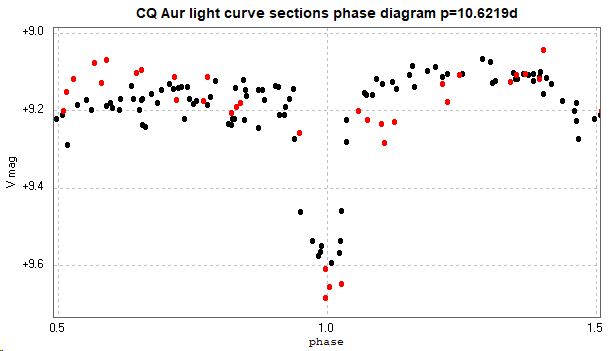
This behaviour, in the maximum and minimum light, was present whichever combination of 5 comparison stars was used in deriving the light curve. This is possibly due to starspot activity on the side of the cooler component (the RS CVn component) facing away from the hotter component. This is not to be confused with the O'Connell effect (possibly, see below) which affects just the maxima. More observations will be made of this system to see if this behaviour continues.
2022 June 13 update
A further 41 observations have been obtained between 2021 February 4 and 2022 April 26. The resulting light curve and phase diagrams to date appear below. All new observations were with the new COAST telescope (a 17 inch/42cm corrected Dall-Kirkham Astrograph) and a V filter.
There is a significant decrease in the magnitude since 2021 August 2. These results appear in black in the following light curve and phase diagram.
2023 June 18 update
The following light curve and phase diagram were constructed from images taken with the OU COAST telescopes using a V filter. The 314 red data points are observations made between 2017 August 8 and 2022 April 26, while the latest 37 observations are in black and were made between 2022 July 31 and 2023 April 12.
The following light curve and phase diagram were constructed from images taken with the OU COAST telescopes using a V filter. The 314 red data points are observations made between 2017 August 8 and 2022 April 26, while the latest 37 observations are in black and were made between 2022 July 31 and 2023 April 12.
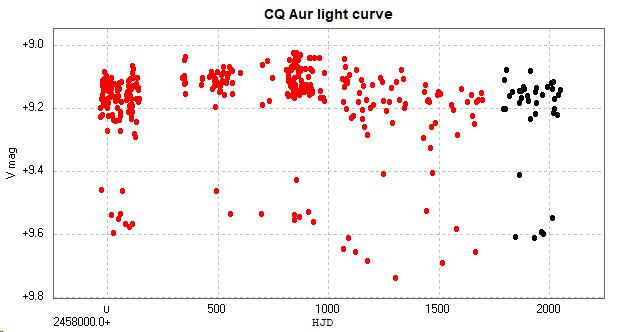
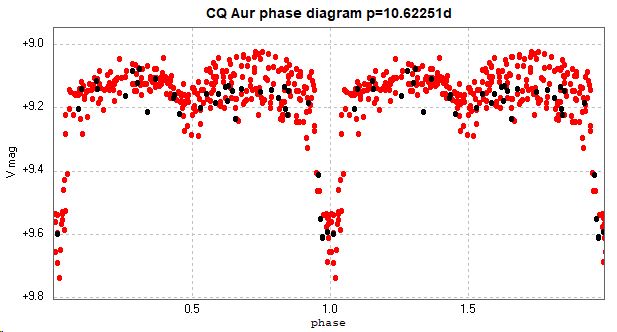
From the available data points it can be seen that the overall brightness is generally increasing again after the recent decrease. The system is catalogued as an EA/RS type, which have a light curve which can have unequal maxima and can also change over many cycles (the O'Connell effect, possibly due to 'starspots' on the RS CVn component, see Kang 1993.).
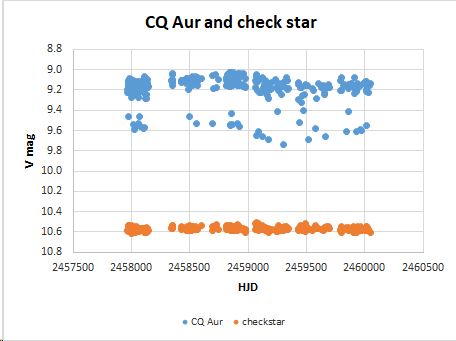
As a check against some potential systematic errors, the following diagram shows the light curve of CQ Aur together with that of the check star. That of the checkstar is essentially constant, and not showing the overall increase/decrease/increase of CQ Aur.
As a check against some potential systematic errors, the following diagram shows the light curve of CQ Aur together with that of the check star. That of the checkstar is essentially constant, and not showing the overall increase/decrease/increase of CQ Aur.
[Page updated 2023 June 18]
