
GK Cephei / GK Cep
Light curves and phase diagrams of the EB type eclipsing binary GK Cephei / GK Cep
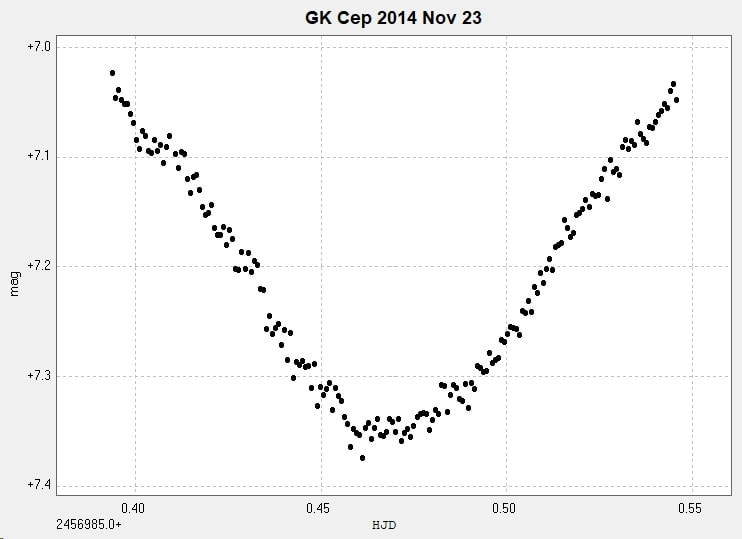
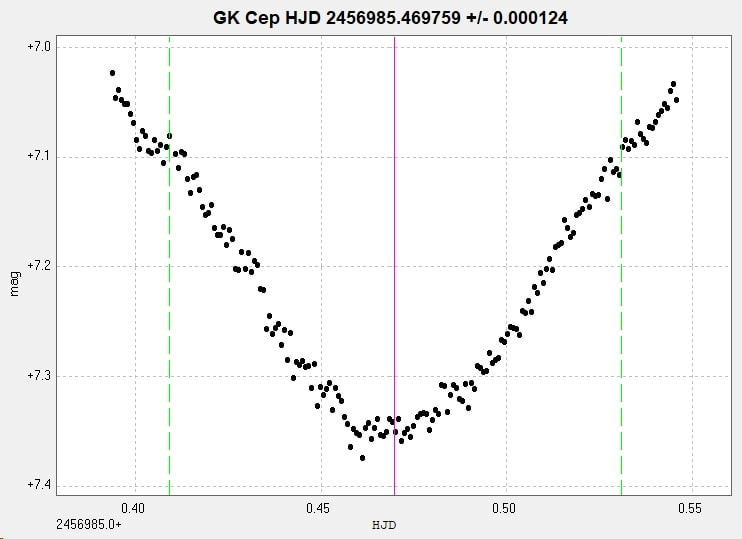
Primary minimum observed with the 2" Titan from Somerby Observatory on 2014 November 23.
There is o-c activity in this system, the o-c curve exhibiting a sinusoidal variation with a period of 18.6 years.
For a discussion see eg Benge and Roberts, JAAVSO 1994.
For a discussion see eg Benge and Roberts, JAAVSO 1994.
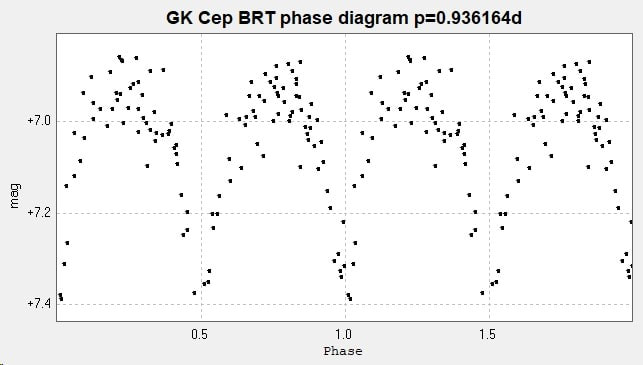
Light curve and phase diagram constructed from photometry of 118 images taken with the Bradford Robotic Telescope Cluster Camera (BRT) between June 2010 and December 2015, using their TG ('green') filter.
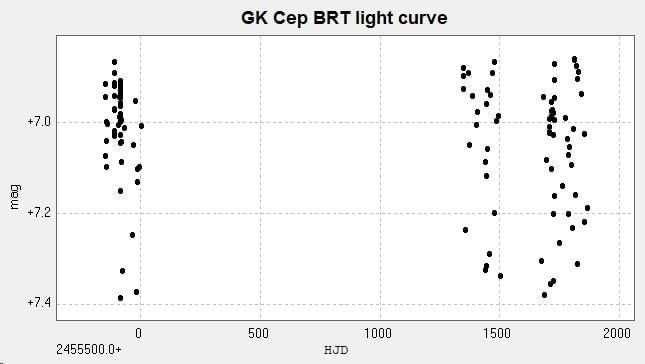
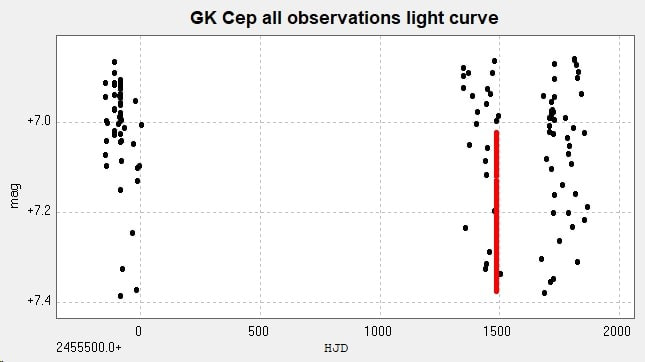
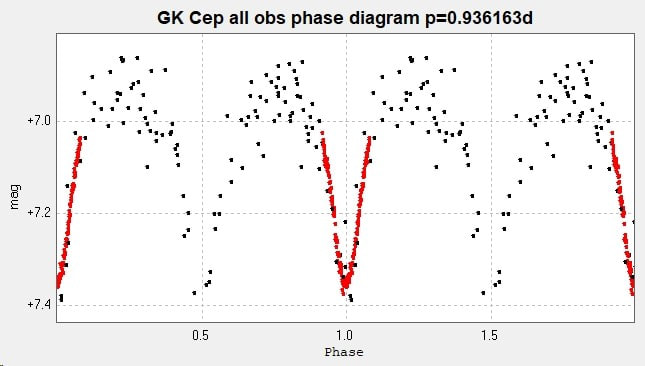
The Bradford observations have been combined with the primary minimum observed from Somerby to construct the following light curve and phase diagram.
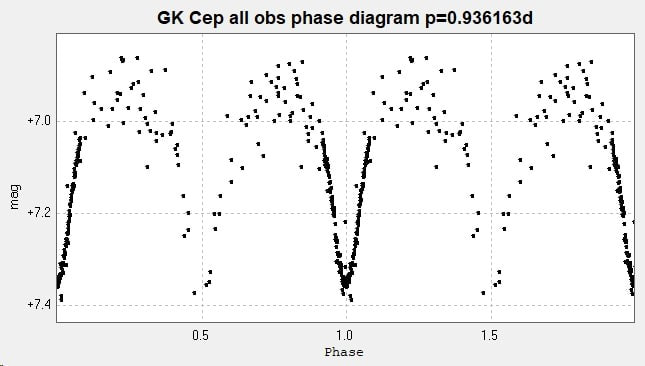
In the colour graphs, the Somerby observations are in red, the Bradford observations are in black. The black and white version of the phase diagram is included for clarity.
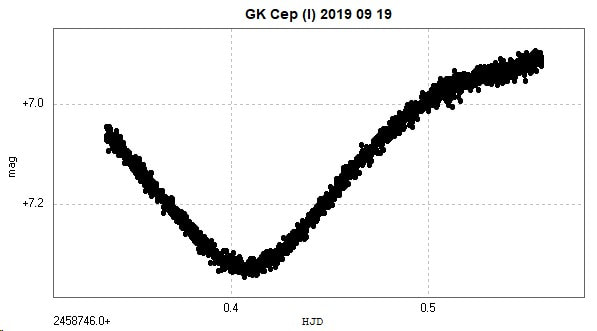
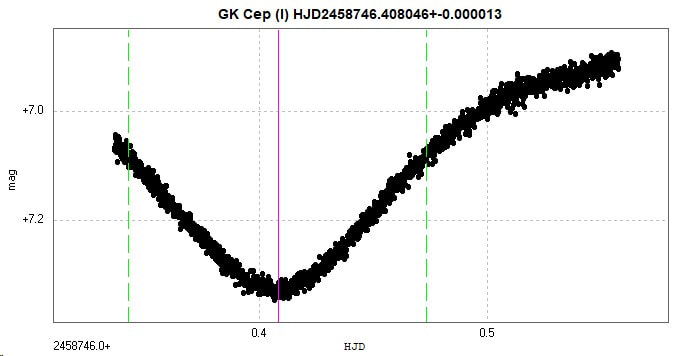
A primary minimum was observed from Somerby Observatory with the 2" Titan on 2019 September 19. The following charts were constructed from the resulting 2028 unfiltered images.
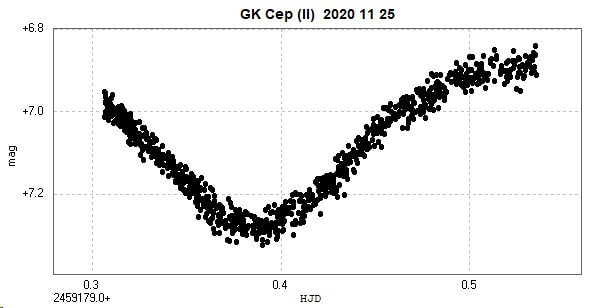
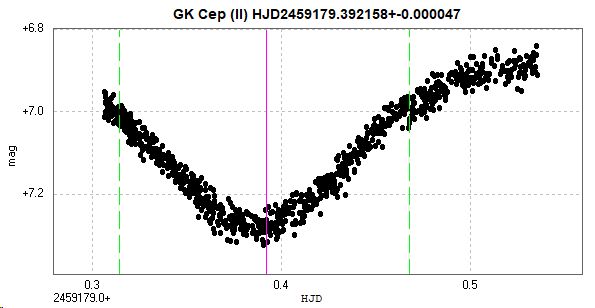
A secondary minimum was observed from Somerby Observatory with the 2" Titan on 2020 November 25. The following charts were constructed from the 876 unfiltered images obtained.
The primary minimum of 2019 September 19 and the secondary minimum of 2020 November 25 were combined into the following phase diagram.
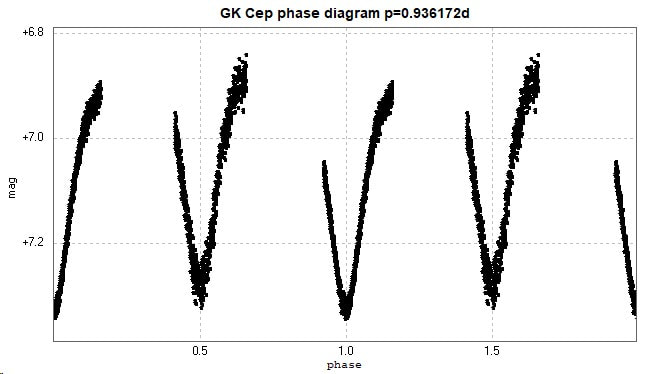
The catalogue period for this star is 0.93616454d (GCVS), 0.93616454d (AAVSO VSX) and 0.93617191d (Kreiner). There is significant o-c activity with this star - see above (Kreiner). (Accessed 2020 November 30.)
The Kreiner period on their o-c page was used in constructing the above phase diagram. The period quoted on their Cepheus page is the same as the GCVS value above. Using this latter value generates a phase diagram where min(II) is not quite at phase 0.5 (see below).
The Kreiner period on their o-c page was used in constructing the above phase diagram. The period quoted on their Cepheus page is the same as the GCVS value above. Using this latter value generates a phase diagram where min(II) is not quite at phase 0.5 (see below).
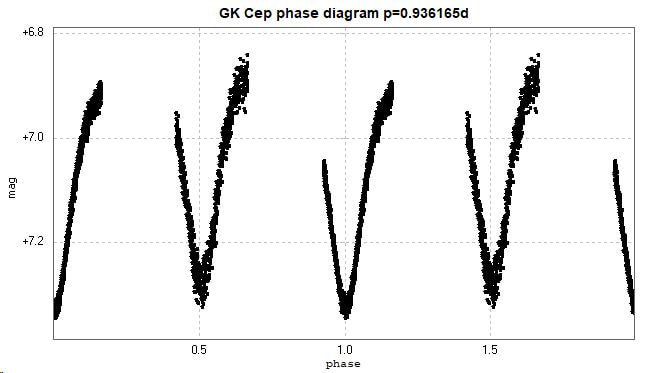
This difference might be explained by the rapid changes to the o-c values over the year between the two sets of observations. More observations of the secondary minimum needed.
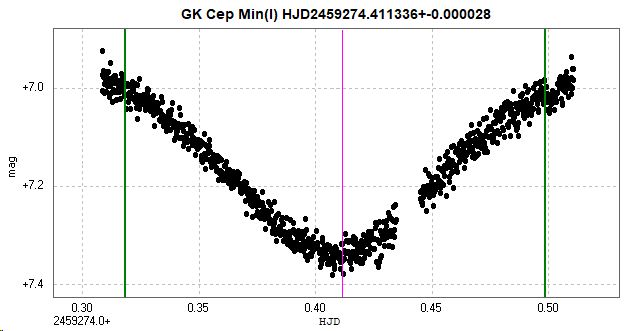
Two consecutive primary minima were observed with the Somerby 2" Titan on the 27th and the 28th of February 2021.
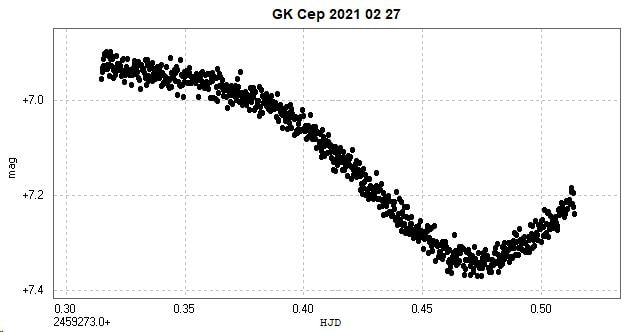
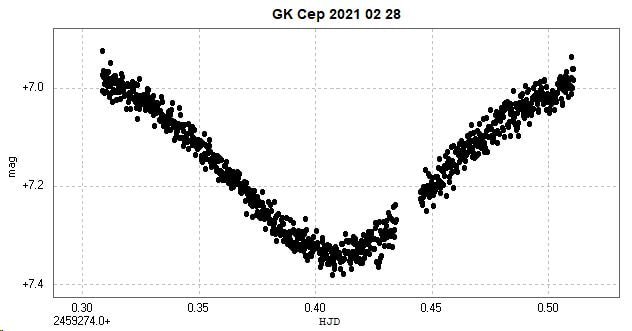
The time of the February 28 minimum was obtained, as below.
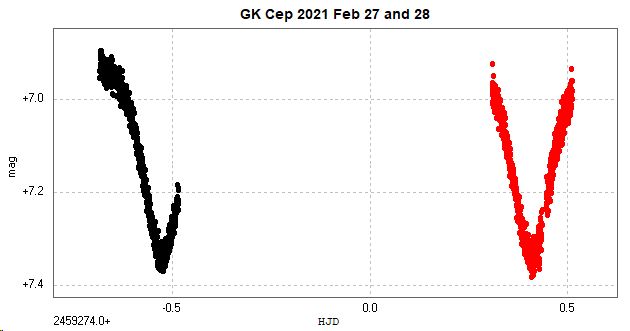
At mag 7, GK Cep requires short exposures with the 2" / 50mm aperture. For these observations I stopped down the aperture for the two runs; 1" / 25 mm for February 27 and 1.25" / 32 mm for February 28. The exposures were adjusted accordingly, 23s and 17s respectively. The following diagram shows the actual light curve, with the February 27 observations in black and the February 28 observations in red.
These were combined into the corresponding phase diagram, below.
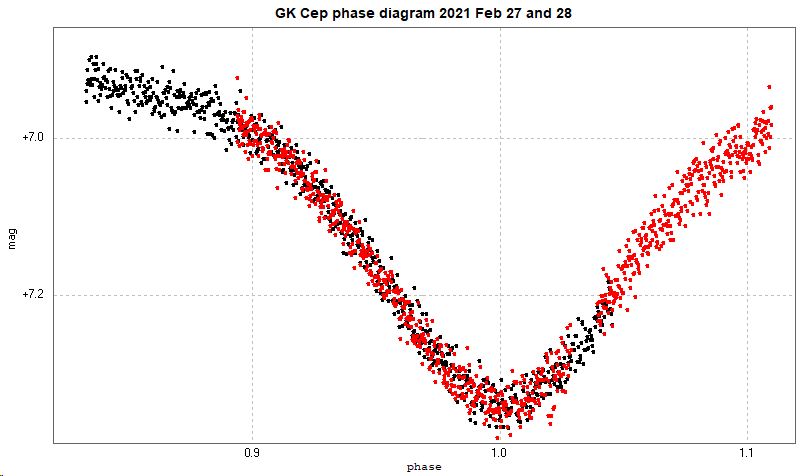
The scatter for the two sets of data appears essentially the same, suggesting that the actual exposure is not too critical provided that they are long enough to counter scintillation and underexposure, while not saturating the pixels.
The catalogue period for this star is 0.93616454d (GCVS), 0.93616454d (AAVSO VSX) and 0.93617191d (Kreiner). There is significant o-c activity with this star - see above (Kreiner). (Accessed 2021 March 3.)
[Page updated 2021 March 3]
