
TT Aurigae / TT Aur
Light curves and phase diagrams of the eclipsing binary TT Aurigae / TT Aur.
TT Aurigae is listed as an EA type eclipsing binary in the GCVS and as an EB/DM type in the AAVSO VSX (accessed 2024 February 12).
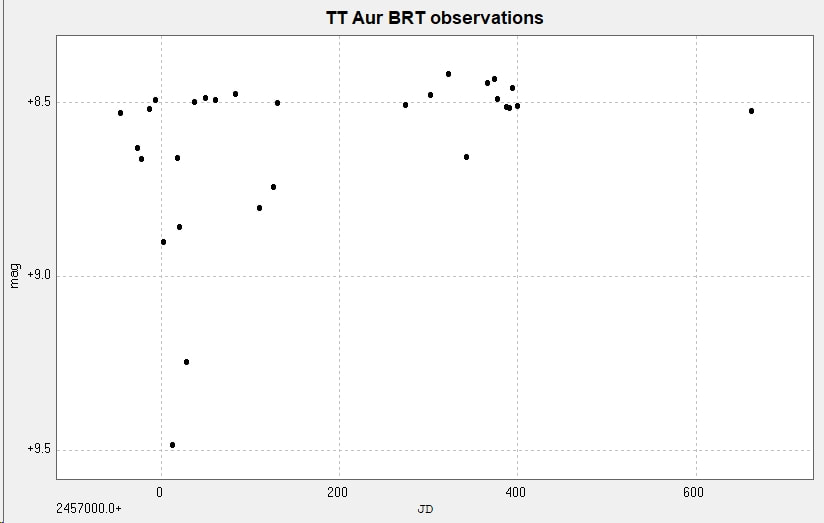
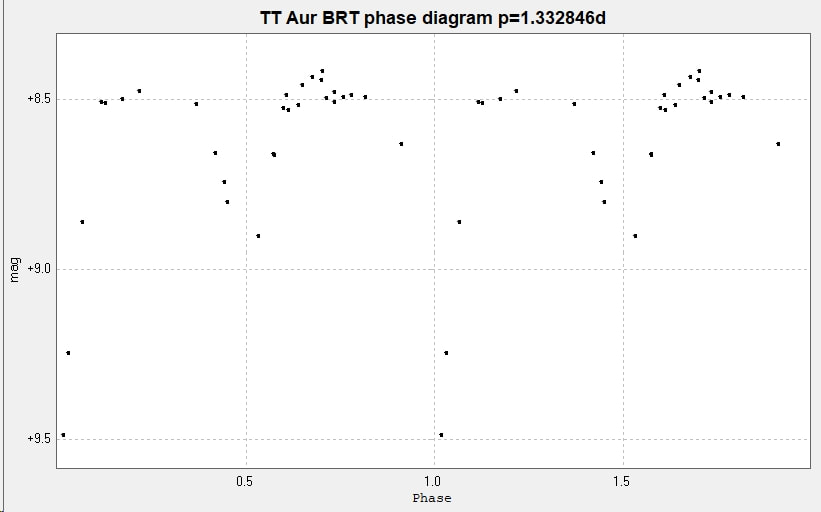
The following light curve and phase diagram were constructed from photometry of 29 images taken with the Bradford Robotic Telescope Cluster Camera (BRT) through their tri-colour green filter between 23 October 2014 and 1 October 2016.
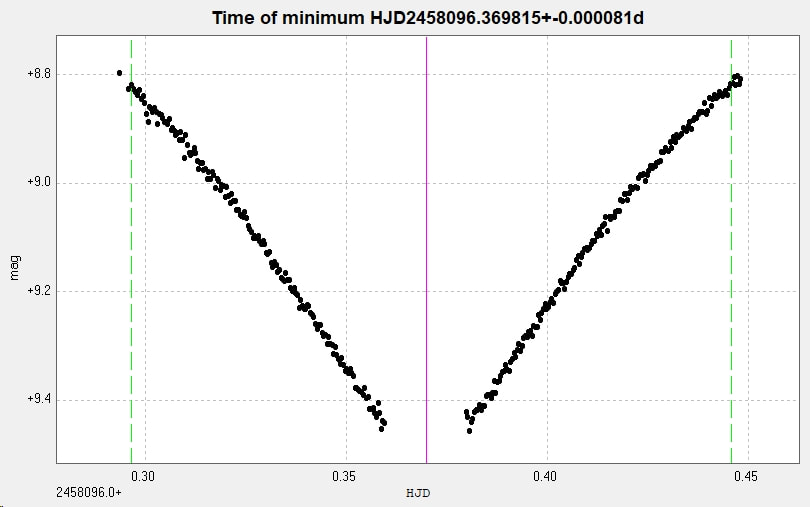
The following primary minimum, on 8 December 2017, was constructed from photometry of 564 unfiltered images taken with the 2" Titan at Somerby Observatory.
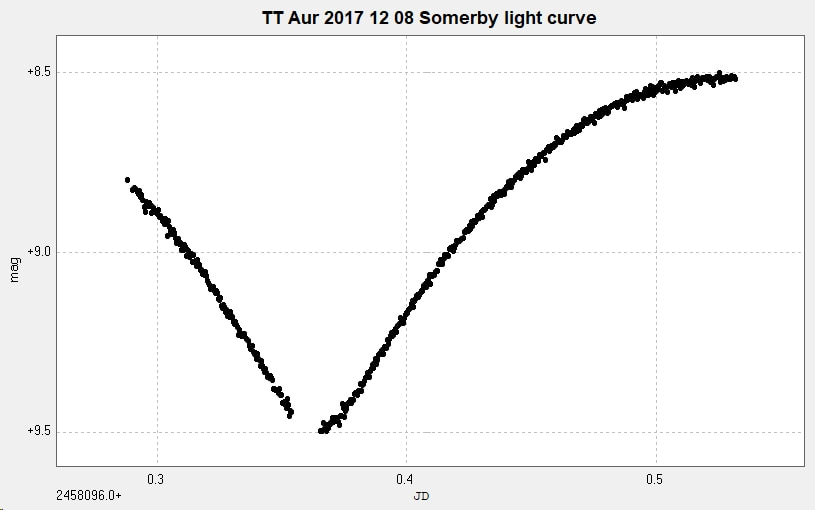
The following HJD of the primary minimum was determined by Peranso from a subset of the above observations, selected to give equal weight to the decline and rise sections of the light curve.
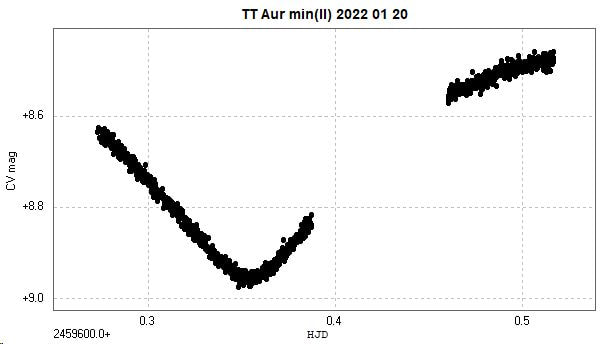
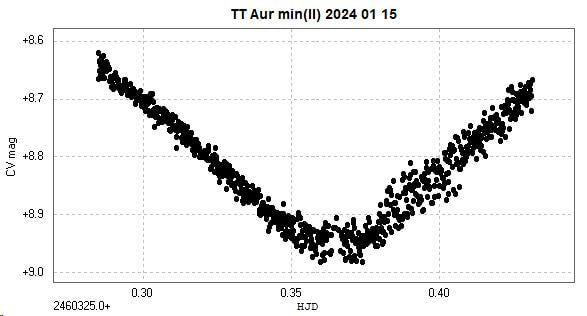
A secondary minimum was observed from Somerby on 2022 January 20. The 957 unfiltered images generated the following light curve (the gap is due to cloud).
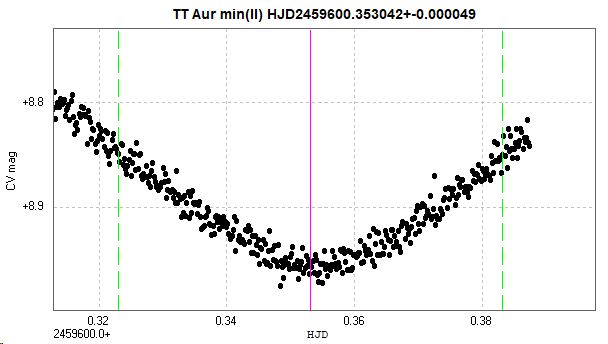
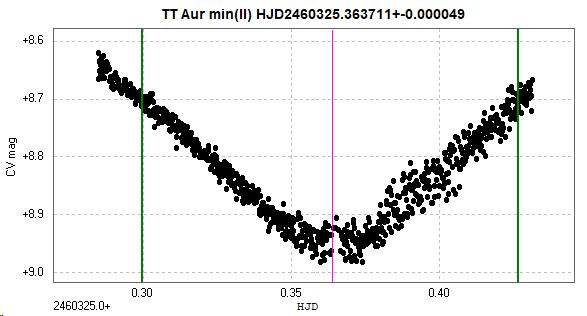
Again using a subset of the observations, an HJD time of minimum was calculated by Peranso.
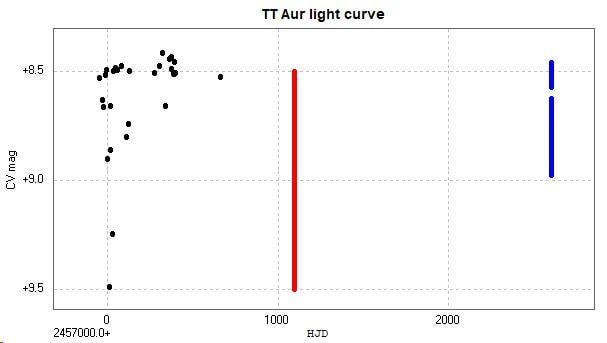
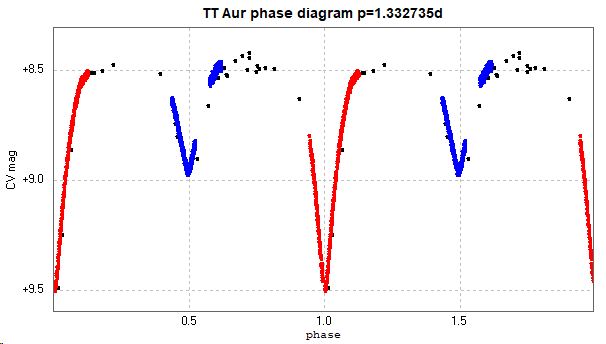
Combining the BRT and Somerby observations into one light curve and phase diagram gave the following figures. The BRT results are in black, the 2017 primary minimum is in red and the 2022 January secondary minimum is in blue.
2024 January update
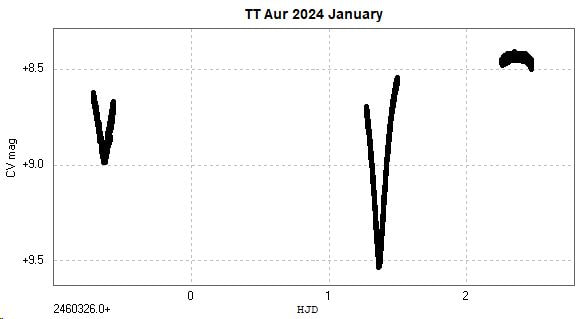
Taking advantage of three nights of clear weather, the following light curves were obtained with the 2" Titan at Somerby Observatory. The images were unfiltered.
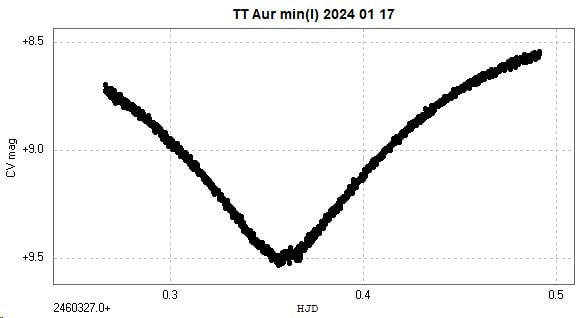
The observations were of a secondary minimum on 2024 January 15, a primary minimum on 2024 January 17 and a maximum on 2024 January 18. These are all shown in the following light curve.
The observations were of a secondary minimum on 2024 January 15, a primary minimum on 2024 January 17 and a maximum on 2024 January 18. These are all shown in the following light curve.
The January 15 secondary minimum is shown below, with the calculated time of minimum, HJD2460325.363711+-0.000049.
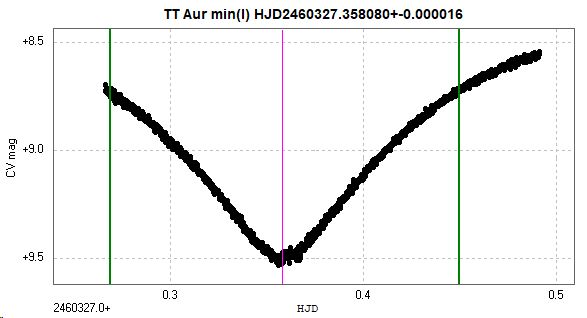
The January 17 primary minimum is shown below, with its calculated time of minimum, HJD2460327.358080+-0.000016.
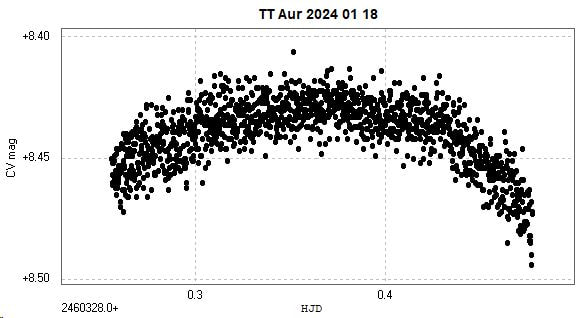
The maximum, between a secondary minimum and a primary minimum, is below.
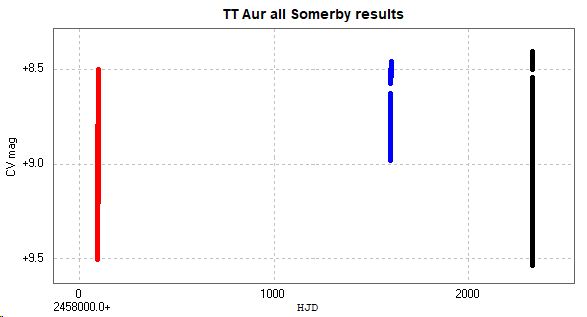
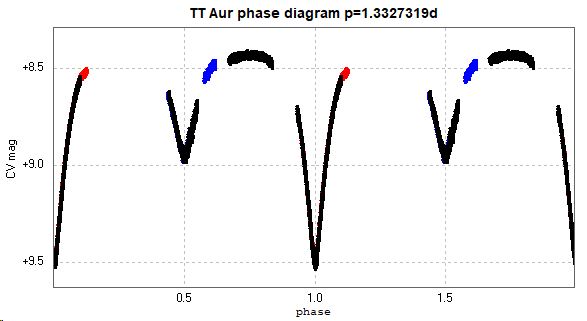
The following light curve and phase diagrams show all of the above results from Somerby; the 2017 December 8 primary minimum is in red, the 2022 January 10 secondary minimum is in blue, and the 2024 January maximum in black.
The following phase diagram is plotted using Kreiner's given period of 1.3327219 days (@2024 January 23)
Enlargements of the primary and secondary minima are shown below. The primary minima fit this period very well, while the secondary minima are not quite so well fitted to this period.
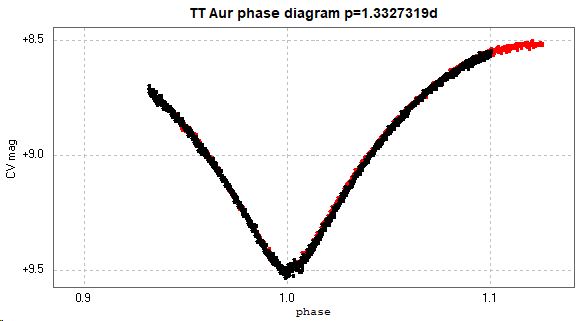
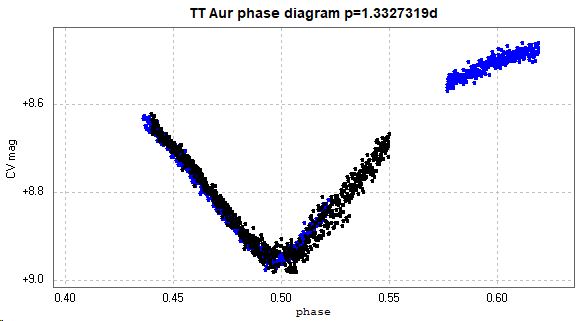
There is o-c activity in this system, which exhibits a small amplitude (approximately +/- 0.01 day), sinusoidal o-c curve with a period of about 20 years (Kreiner), which might be responsible for this slight misfit to the given period.
The catalogued period of this system is given as 1.332735d (GCVS, AAVSO VSX). (Accessed 2024 January 24)
The following articles discuss some research about this system.
TT Aurigae: a B-type semi-detached eclipsing binary, Popper et al (1986)
Gravity Darkening in Semi-Detached Binary System TT Aurigae, Djurašević and Erkapić (2000)
UBV Photometry of the Massive Eclipsing Binary TT Aur, S. Özdemir et al (2001)
[This page updated 2024 February 12]
