W Serpentis / W Ser
W Serpentis is a complex system, with mass transfer and an accretion disc affecting the light curve, see e.g. Strupat et al.
My results and analysis are an attempt to see if BRT data can replicate the results obtained by other observers with different equipment and observing regimes. So far (November 2015), my results are inconclusive.
My results and analysis are an attempt to see if BRT data can replicate the results obtained by other observers with different equipment and observing regimes. So far (November 2015), my results are inconclusive.
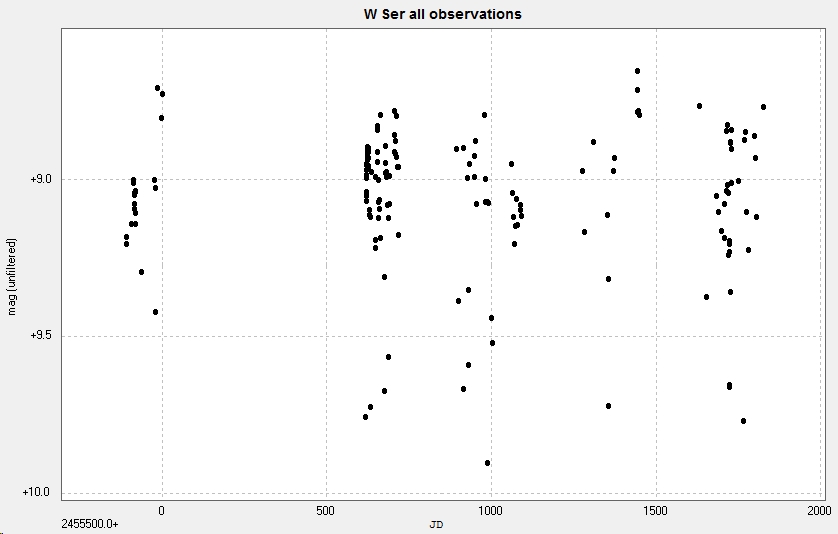
163 unfiltered images of W Serpentis / W Ser taken with the Cluster Camera of the Bradford Robotic Telescope, between 12 July 2010 and 29 October 2015.
The results have not been transformed.
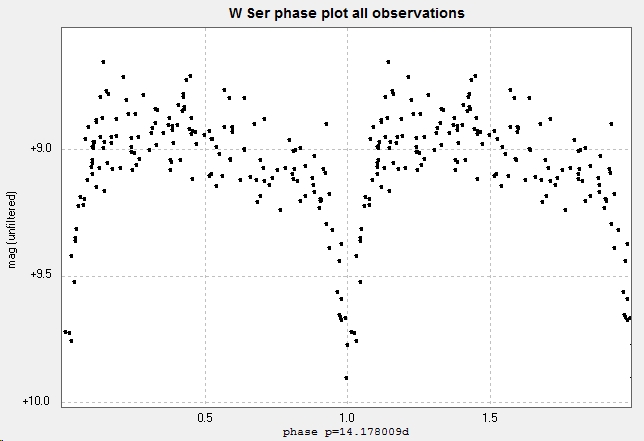
Note that the phase plots use the best fit period as determined by Peranso/Anova for each data set. Nothing is to be inferred from the (very large) apparent increase in the period other than insufficient data!
The results have not been transformed.
Note that the phase plots use the best fit period as determined by Peranso/Anova for each data set. Nothing is to be inferred from the (very large) apparent increase in the period other than insufficient data!
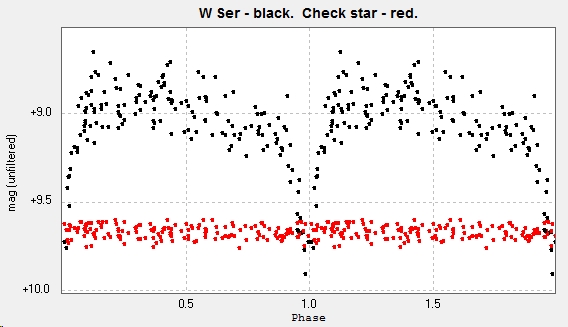
The light curve has a large 'scatter', of about 0.5 mag. This is larger than expected from photometry of correctly exposed BRT images, as is evidenced by the much narrower scatter of the check star's red light curve below.
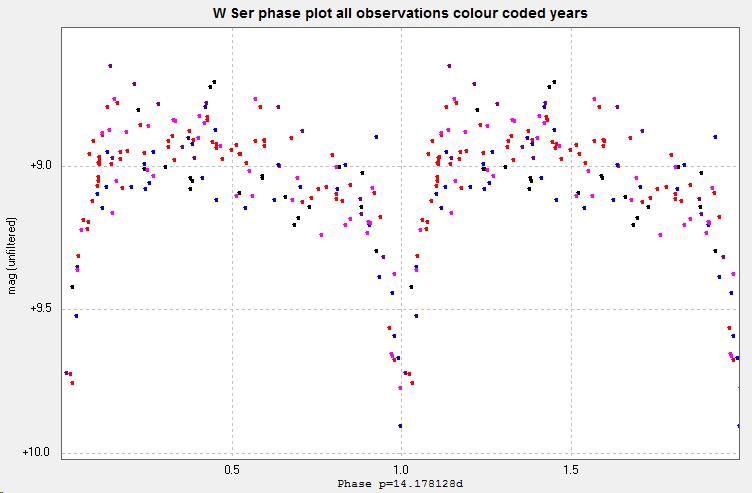
Observations from different years are shown above.
2010 - black 2012 - red 2013 - blue 2014 - purple 2015 - magenta
Below are shown the observations from each year plotted as a phase diagram.
2010 - black 2012 - red 2013 - blue 2014 - purple 2015 - magenta
Below are shown the observations from each year plotted as a phase diagram.
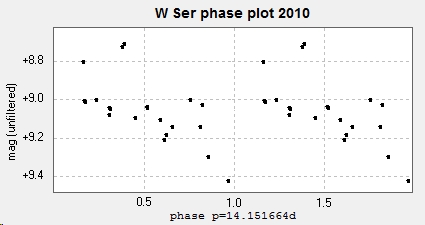
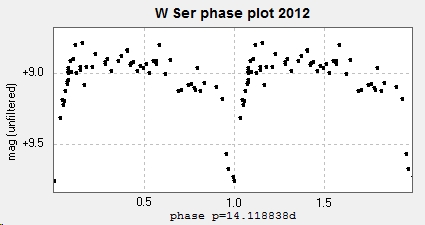

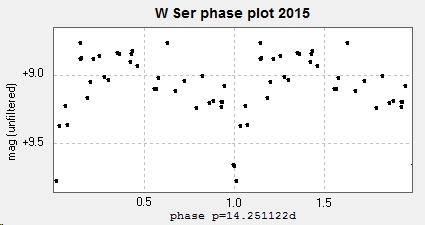
There is some evidence that the light curve is changing with time, but the overlapping curves within each phase diagram are still causing some scatter.
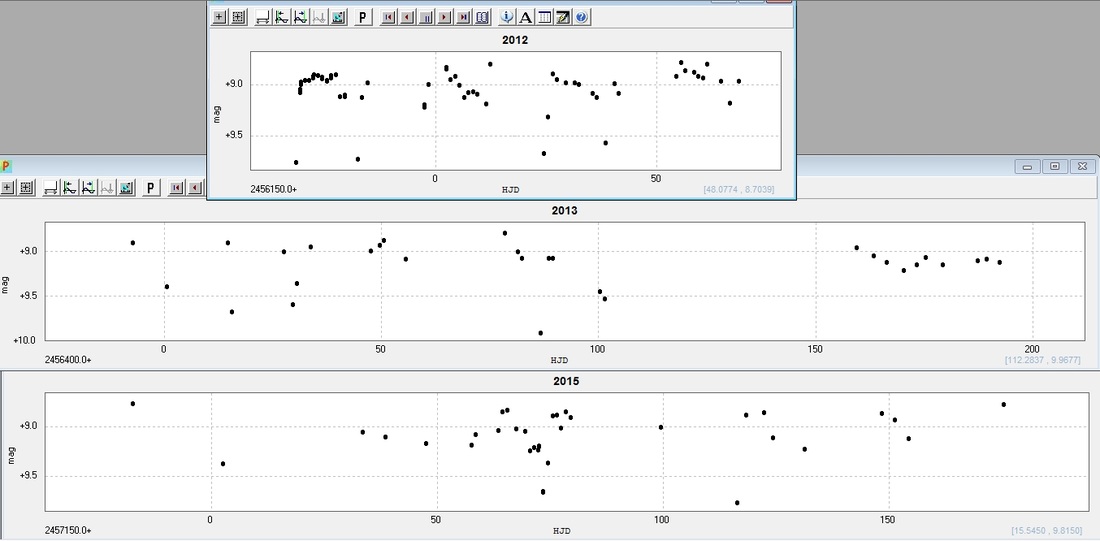
Below, the light curves from 3 years' worth of data are aligned by eye to see if there are any obvious differences in them. Unfortunately the gappy nature of BRT data makes it difficult to draw any firm conclusions about changes from one cycle to the next.