
CD Andromedae / CD And
Light curve and phase diagrams of the EA type eclipsing binary CD Andromedae / CD And. Please note that a previous version of this page appears afterwards with an earlier analysis of this system for the sake of completeness.
This is an under-observed system, and historical records and observations are not always consistent with each other. I hope to investigate this system further in the fullness of time, but in the meantime these are my own observations to date (April 2024).
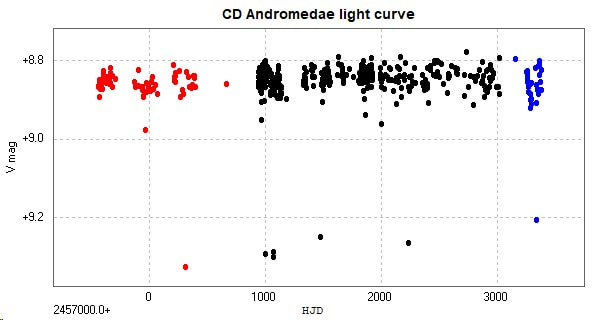
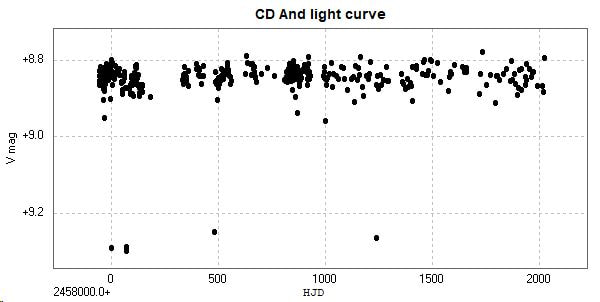
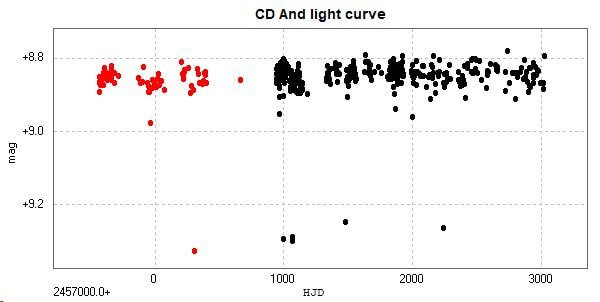
The black data points are from 384 images taken between 2017 July 6 and 2023 March 18 with the Open University COAST telescope using a V filter.
The blue data points are the latest season's results, and consist of 30 results from 2023 August 3 to 2024 March 15, also from images taken with the Open University COAST telescope using a V filter.
74 observations had previously been obtained with COAST's precursor, The Bradford Robotic Telescope Cluster Camera (BRT), between 2013 September 30 and 2016 October 1. Although different comparisons were used (due to different fields of view) and different filters were used ('green' instead of V), they were included in the light curve below. The BRT results are in red.
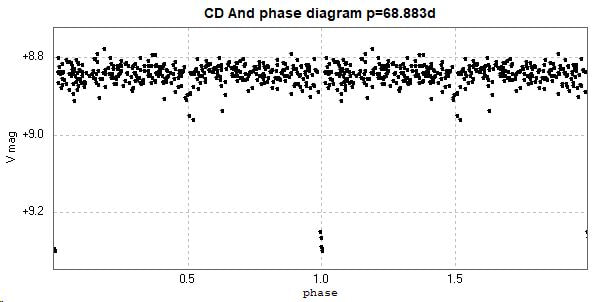
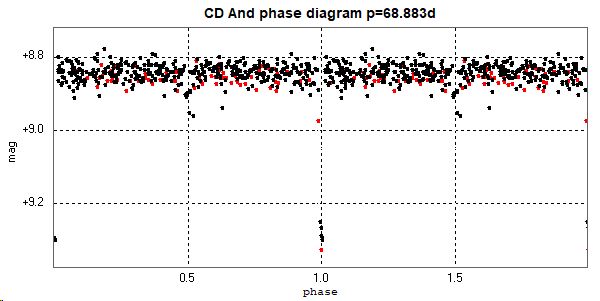
The catalogue value for the period of this star is 68.8832 days (GCVS, AAVSO VSX, Kreiner.) (Accessed 2024 April 13). The following phase diagram, plus enlargements, were constructed using this period.
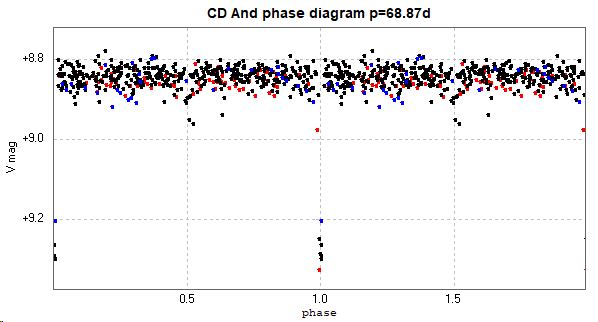
Note that the GCVS states that there are two, equal minima of depth 0.5 mags per cycle. My observations are inconsistent with this. The ASAS-SN Catalog of Variable Stars: II also strongly suggests only one minimum per 68 day cycle. That said, both my data and the ASAS data are very noisy and may be concealing a secondary minimum of smaller amplitude. In addition, radial velocity data obtained by Imbert, M. (2002), strongly indicates that the 68.8832d period is the correct one.
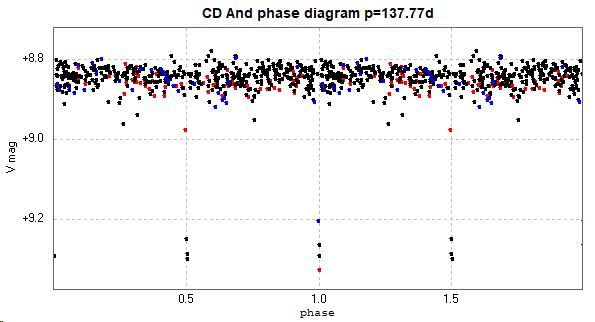
Two equal minima per cycle can be generated using a period of 137.77 days, as shown below. This could have contributed to the apparent contradiction, but I can find no evidence for this being the case.
Also, there have been suggestions that the period is 34.44 days, see the phase diagrams below.
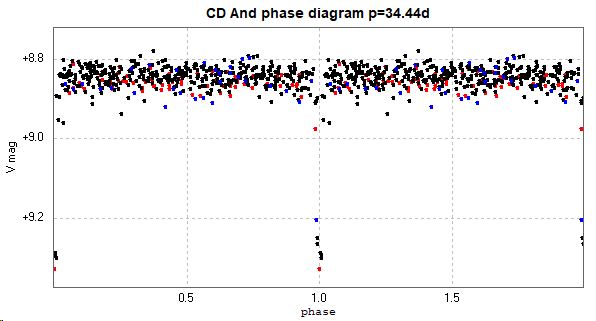
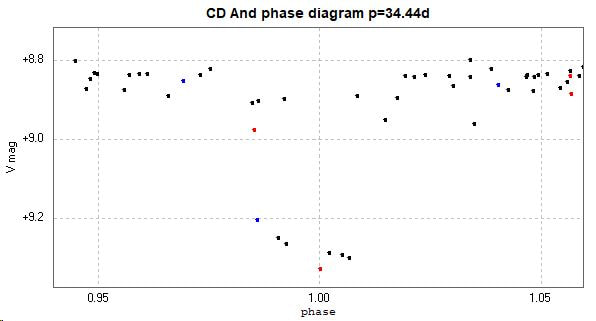
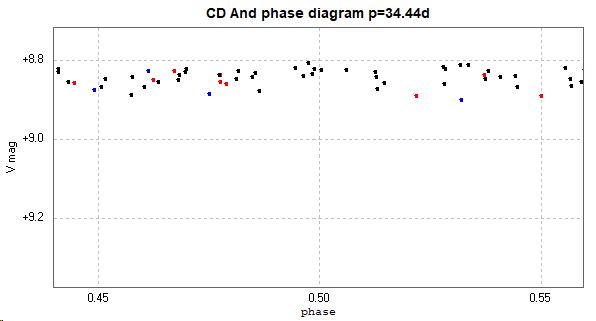
The 34 day period was suggested by Hoffmeister in 1955, based on one data point, the other data points being consistent with the 68 day period.
It is also the value given in A Catalogue of Parameters for Eclipsing Binaries, by Brancewicz and Dworak (1980).
Furthermore, the 34 day period is given in the Krakow Old Ephemerides up to 2012. Data for this year suggests that 15 primary minima and no secondary minima (from the years 1931 to 2004) were used, while 26 mimima, consisting of 8 primary and 18 secondary minima, were used subsequently (from the same years, 1931 to 2004). This latest data was used up to 2020.
It is evident that this system is under-observed, and it will remain in my observing program for the time being.
The above was added 2024 April 13.
The following is the April 2023 version of this page.
Light curves and phase diagrams of the EA type eclipsing binary CD Andromedae / CD And. These were constructed from 384 images taken between 2017 July 6 and 2023 March 18 with the Open University COAST telescope using a V filter.
Due to changes to the available instruments, the light curve was constructed from photometry of images taken with several different systems. However, the comparisons used remained the same, and the checkstar showed no deviation between instruments.
Due to changes to the available instruments, the light curve was constructed from photometry of images taken with several different systems. However, the comparisons used remained the same, and the checkstar showed no deviation between instruments.
The catalogue value for the period of this star is 68.8832 days (GCVS, AAVSO VSX, Kreiner.) (Accessed 2023 April 13)
This period generated the following phase diagram.
According to the GCVS, the primary and secondary minima should both have a depth of 0.5 mag.
From these observations there is indeed a primary minimum of approximately 0.5 mag depth, but a secondary minimum is not conspicuous in this data although there are a few data points suggesting one. The following investigation was carried out.
Investigation
74 observations had previously been obtained with COAST's precursor, The Bradford Robotic Telescope Cluster Camera (BRT), between 2013 September 30 and 2016 October 1. Although different comparisons were used (due to different fields of view) and different filters were used ('green' instead of V), they were included in the light curve below. The BRT results are in red and the COAST results are in black.
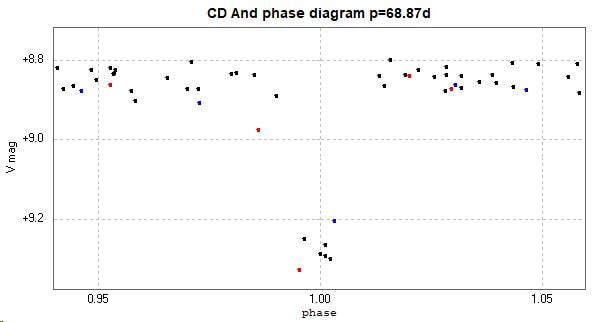
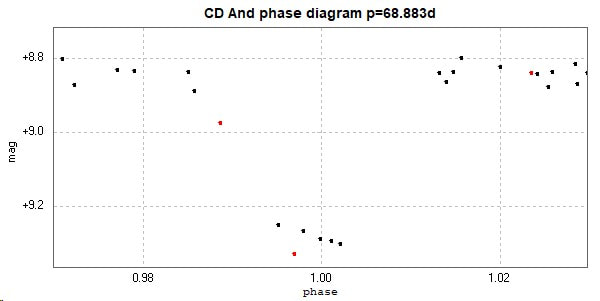
Again, a 'conspicuous' primary minimum but little strong evidence of a secondary minimum. Enlargements of the phases of the primary and secondary minima appear below.
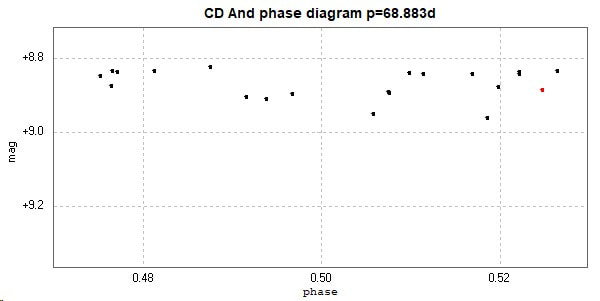
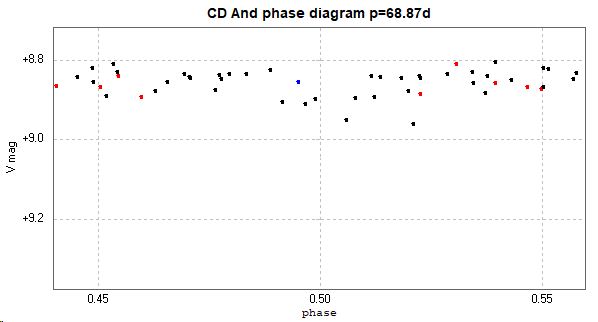
The presence of a secondary minimum at phase 0.5 appears possibly inconsistent with the primary minimum in terms of its width, but the data is 'gappy' here and is inconclusive.
However, doubling the period to 137.77d resulted in the following phase diagram.
However, doubling the period to 137.77d resulted in the following phase diagram.
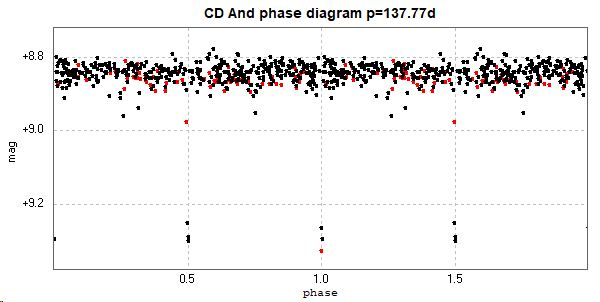
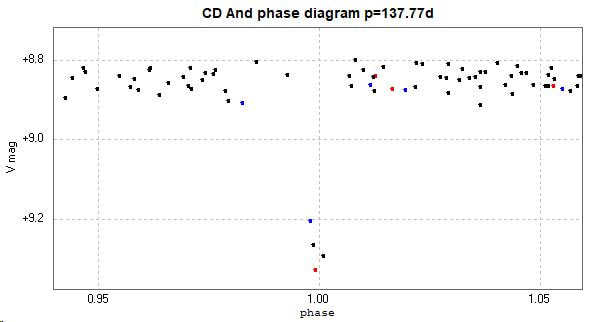
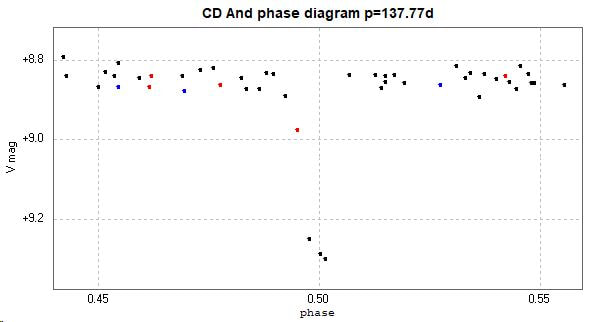
Enlargements of the primary and secondary minima appear below.
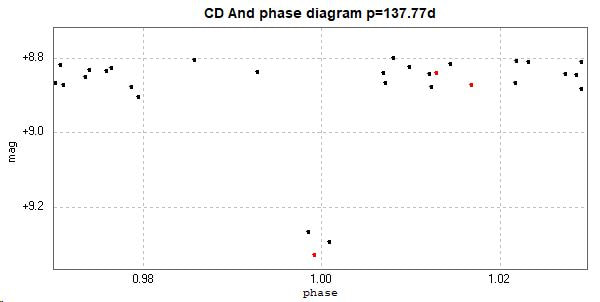
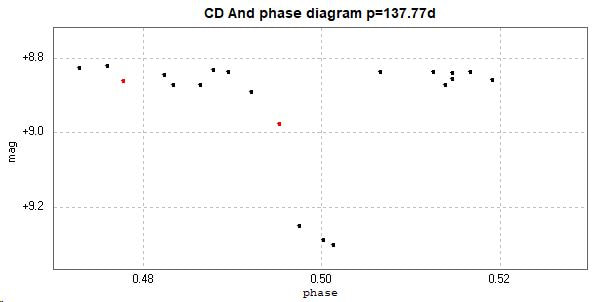
Here, the depths of the primary and secondary minima are consistent with the GCVS data, and their widths are superficially consistent with each other.
However, this period is inconsistent with radial velocity data obtained by Imbert, M. (2002), which does indeed indicate that the 68.8832d period is the correct one.
This system needs more observations to resolve this apparent discrepancy with the secondary minimum and it remains in my observing program.
[This page updated 2024 April 13]
