
IU Aurigae / IU Aur
Light curves and phase diagrams for the EB type eclipsing binary IU Aurigae / IU Aur.
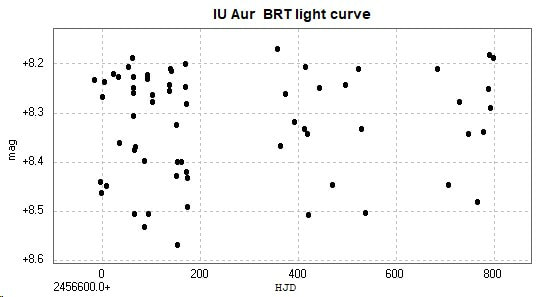
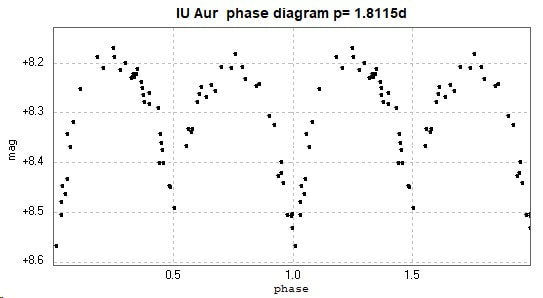
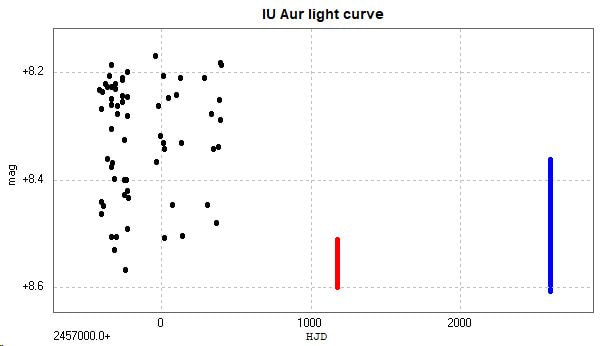
The following light curve and phase diagram were constructed from photometry of 64 images taken with the Bradford Robotic Telescope Cluster Camera ('BRT', a 63mm f3 lens) between 2013 October 17 and 2016 January 11. The images were unfiltered.
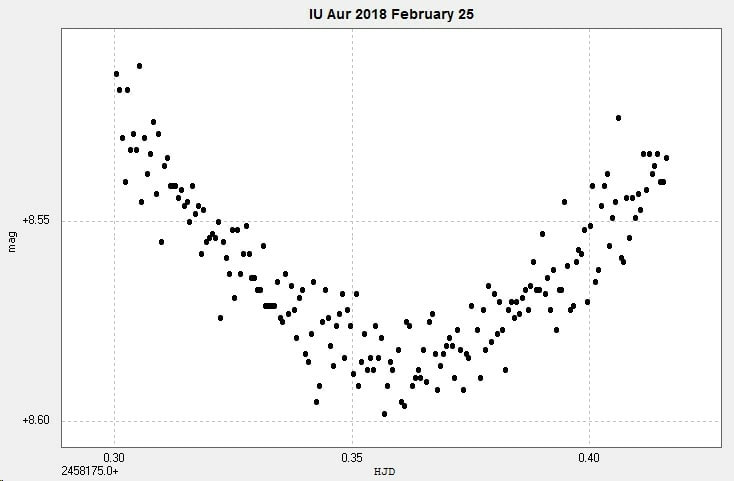
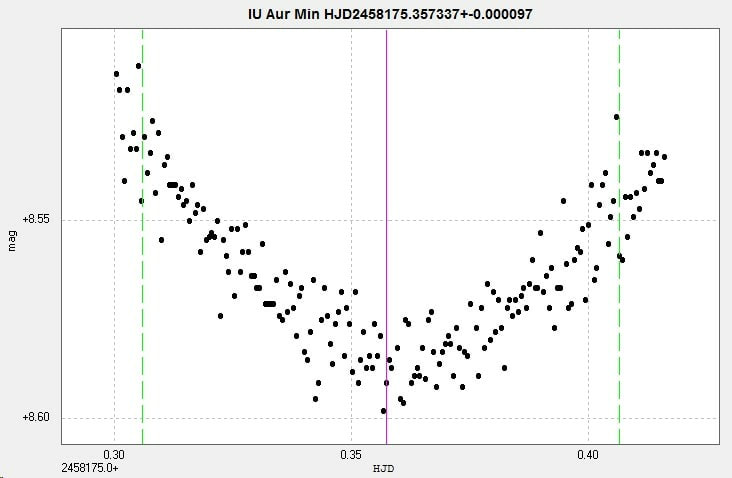
A primary minimum was observed with the 2" Titan at Somerby Observatory on 2018 February 25. The images were unfiltered. The time of minimum was calculated by Peranso's Kwee-van Woerden implementation (http://www.cbabelgium.com/peranso/).
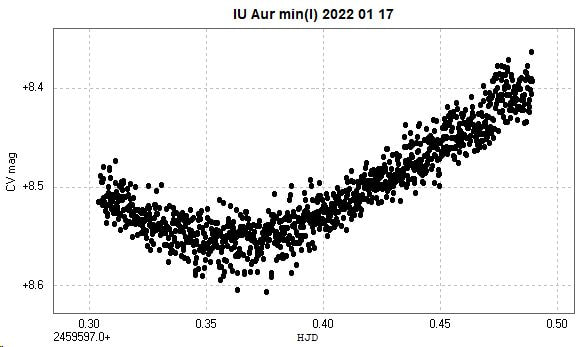
The following primary minimum was observed from Somerby on 2022 January 17. It is rather noisy due to the closeness to the almost full Moon, and insufficient observations were obtained before the minimum to determine an accurate time of minimum.
The above sets of data were combined into the following light curve and phase diagram, the BRT data in black and the Somerby data for 2018 in red and 2022 in blue. Note that none of the data has been transformed, hence the apparent magnitude range in the diagrams is only approximate.
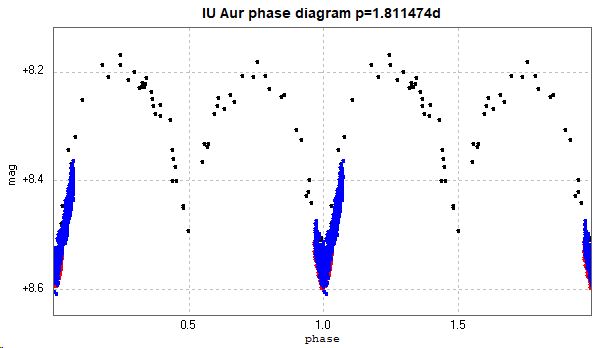
The catalogued period for this star is 1.8114770d (AAVSO VSX) and 1.81147435d (GCVS, Kreiner) . (Accessed 2022 January 19).
There is some activity in the o-c values due to the presence of a third body (Lloyd p40).
[ This page updated 2022 January 19 ]
